Hi @vbala ,
In eazyBI, you can organize issues in the hierarchy, like Feature → Epic → Story. Using hierarchy with measures, measure values are automatically aggregated at each hierarchy level.
-
First, create the hierarchy in the Issue dimension. Here is a community post on how to do this:
How to create an additional issue hierarchy -
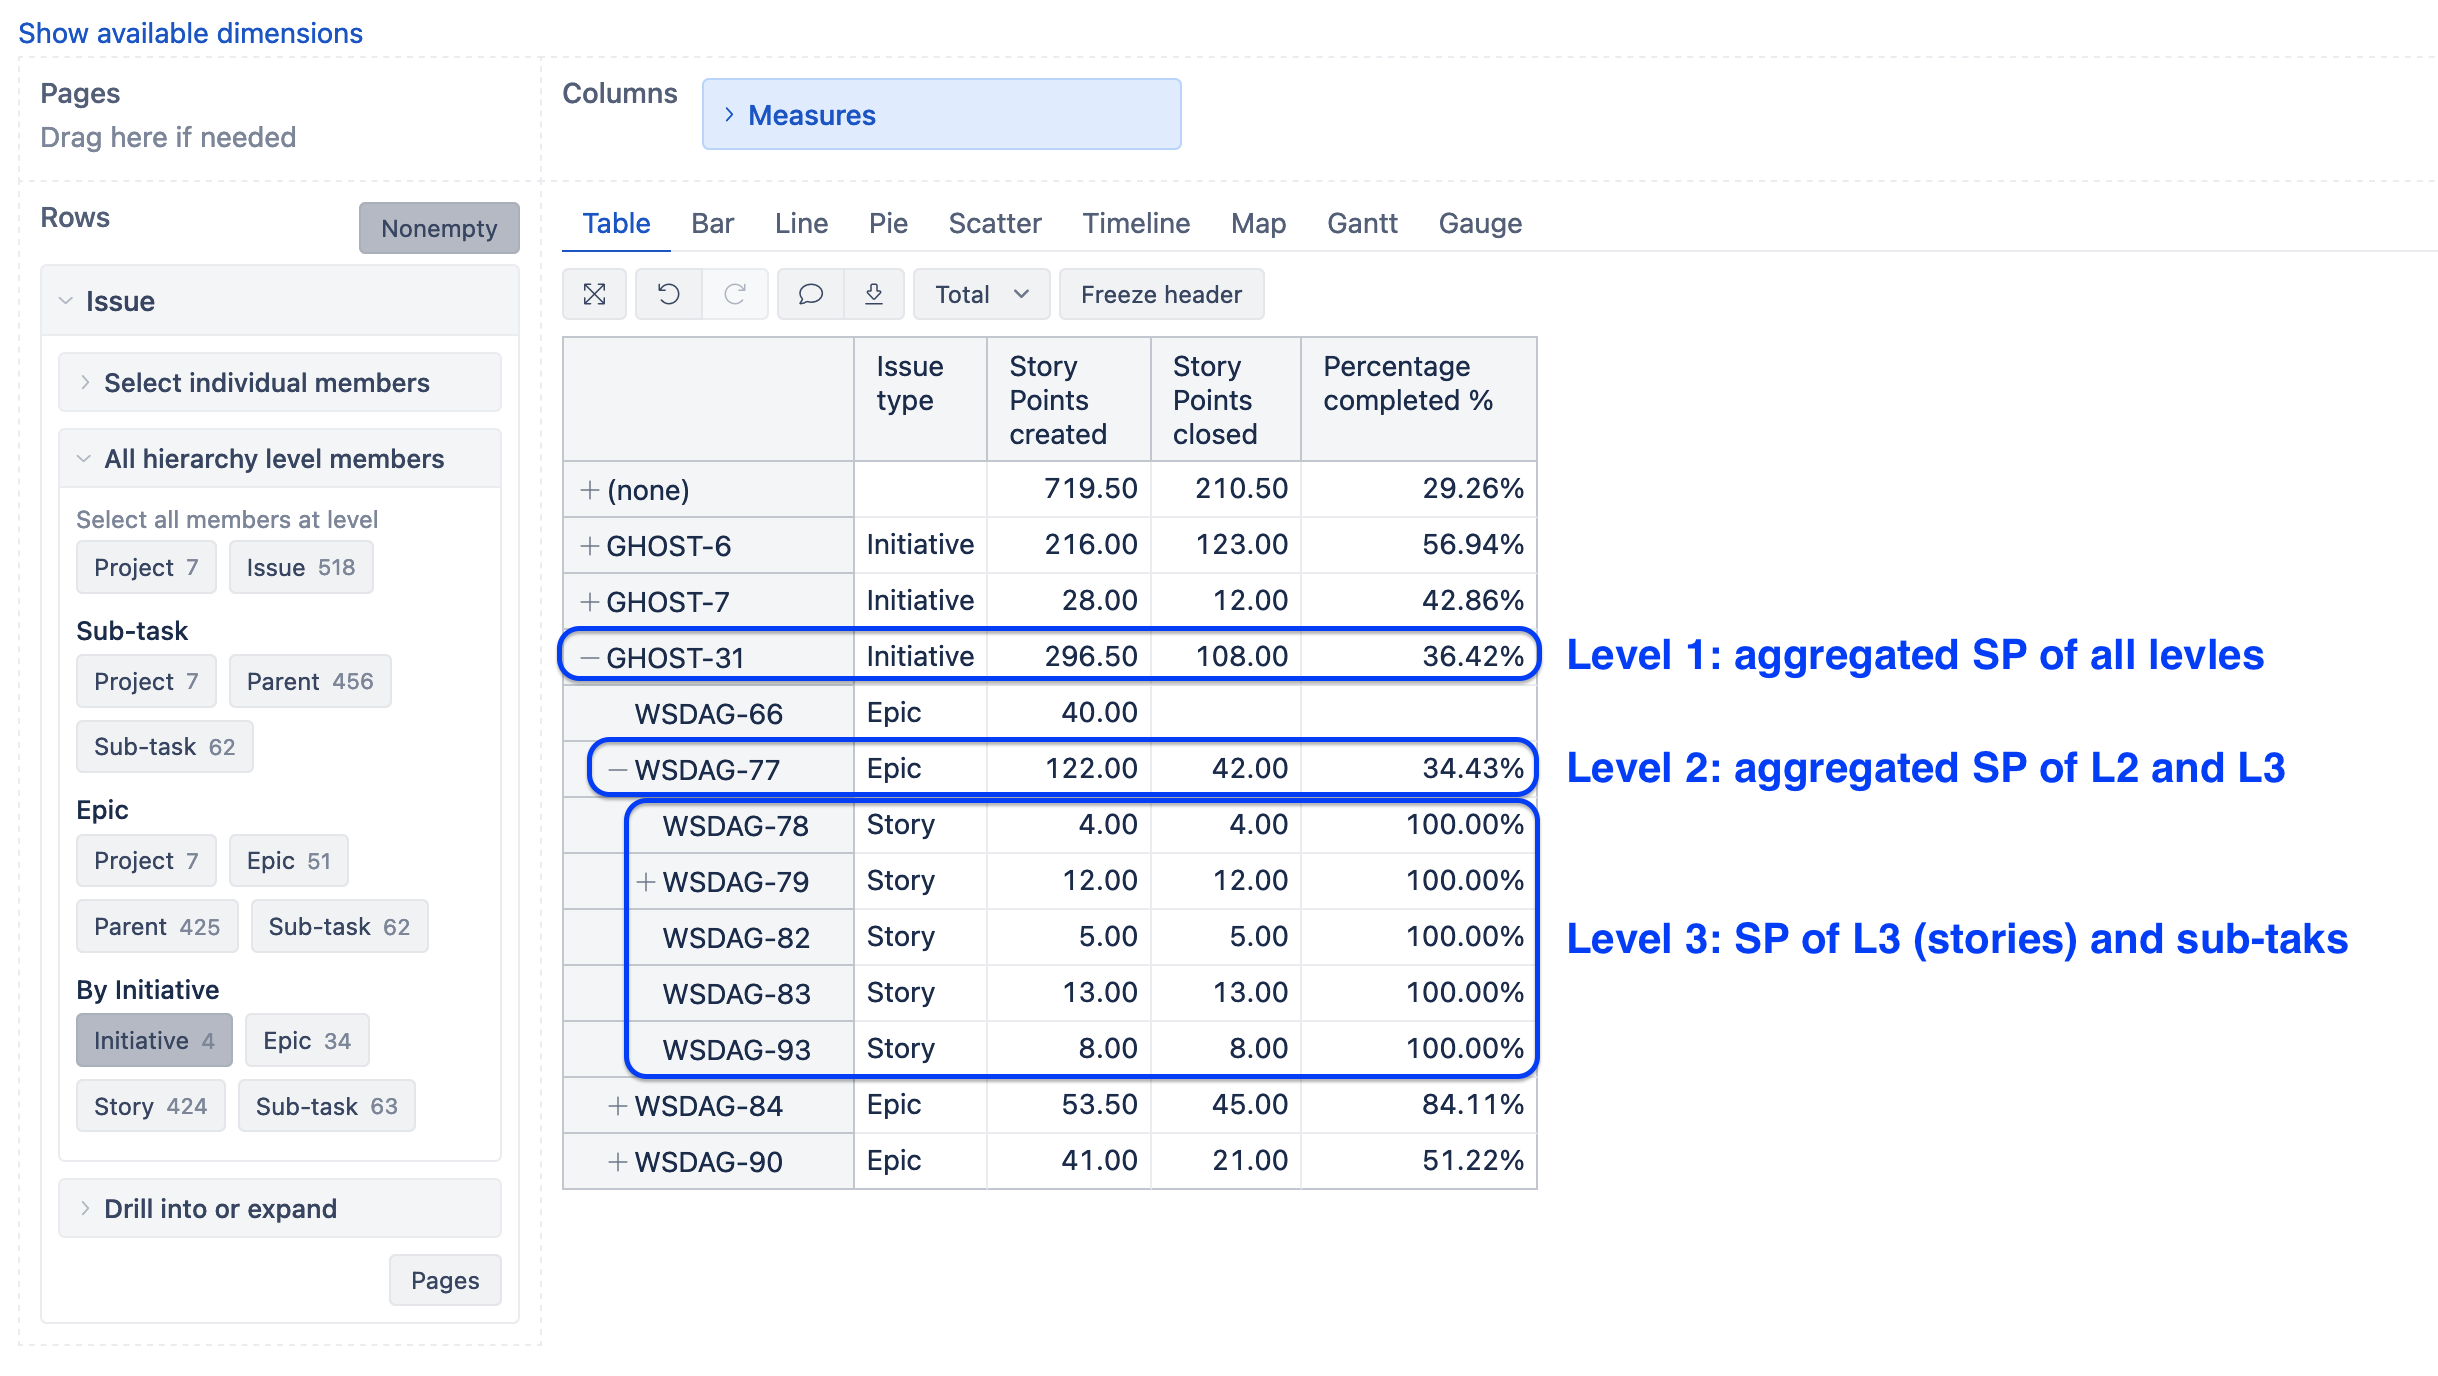
For the report, set the “Issue” dimension on report rows and select the new hierarchy.
-
On report columns, select measures “Story Points created” to see the total op sorry points for each hierarchy level. Select measure “Story Point resolved” to get story points of resolved issues or “Story Points closed” to get story points for issues that are in closed status.
For more details on the mentioned measure, see the documentation: Jira Software custom fields. -
Create a new calculated measure to calculate the % of closed Story Points. In your case, the expression is dividing of two measures – closed story point divide with total story points:
[Measures].[Story Points closed]
/
[Measures].[Story Points created]
Set measure formatting to percentage %.
More details and examples on calculated measures are described in the documentation: Calculated measures.
Best,
Zane / support@eazyBI.com