Hi all:
I want to create a report that shows how much time issues were in the different statuses during their life cycle and I want to show those numbers on age intervals, similar to the Excel example below
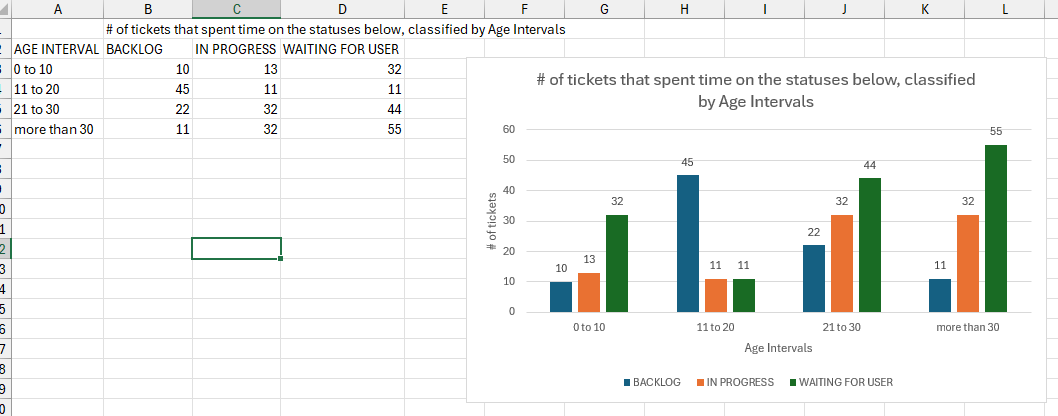
Any ideas?
Thanks
W.
Any ideas? I cannot continue analyzing our situation due to this.
![]()
Hello Does the following reports we have developed assist you with your reporting use case??
Hi @walterdp,
Thanks for posting your question!
Based on your description, the best approach here would be to use the “Age in status” interval dimension. It’s not in the eazyBI Issues cube by default, so you would need to use advanced settings to define it by the following JavaScript:
[jira.customfield_age_is]
name = "Age in status interval"
data_type = "integer"
dimension = true
javascript_code = '''
var fcd;
if (issue.changelog && issue.changelog.histories && issue.changelog.histories.length > 0) {
  var histories = issue.changelog.histories;
  for (var i = histories.length - 1; i >= 0; i--) {
    var history = histories[i];
    if (history.items && history.items.length > 0) {
      for (var n = 0; n < history.items.length; n++) {
        var item = history.items[n];
        if (item.field == "status") {
          fcd = history.created;
        }
      }
    }
    if (fcd) {
      break;
    }
  }
}
if (fcd) {
  issue.fields.customfield_age_is = Math.floor(Date.parse(fcd) / 1000);
} else {
  issue.fields.customfield_age_is = Math.floor(Date.parse(issue.fields.created) / 1000);
}
'''
time_unit = "seconds"
time_interval = "age"
intervals = "0-10,11-20,21-30,30-..."
interval_unit = "days"
You can read more about advanced settings in our documentation here: Advanced settings for custom fields
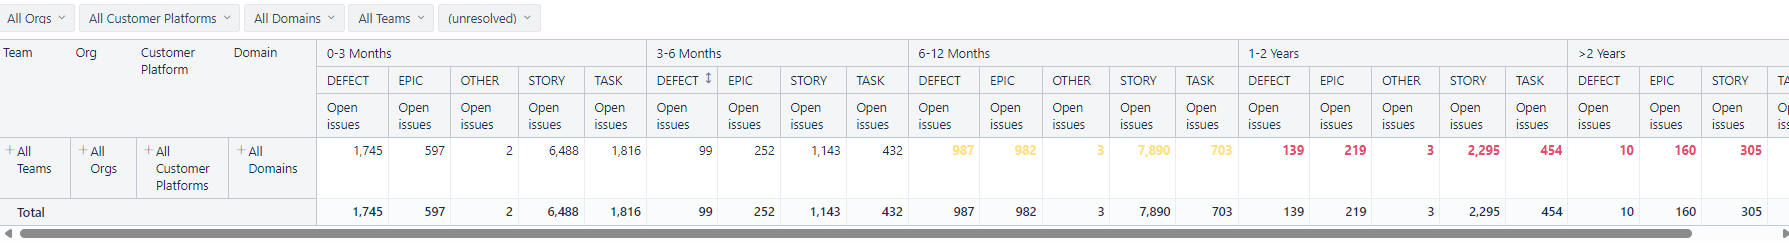
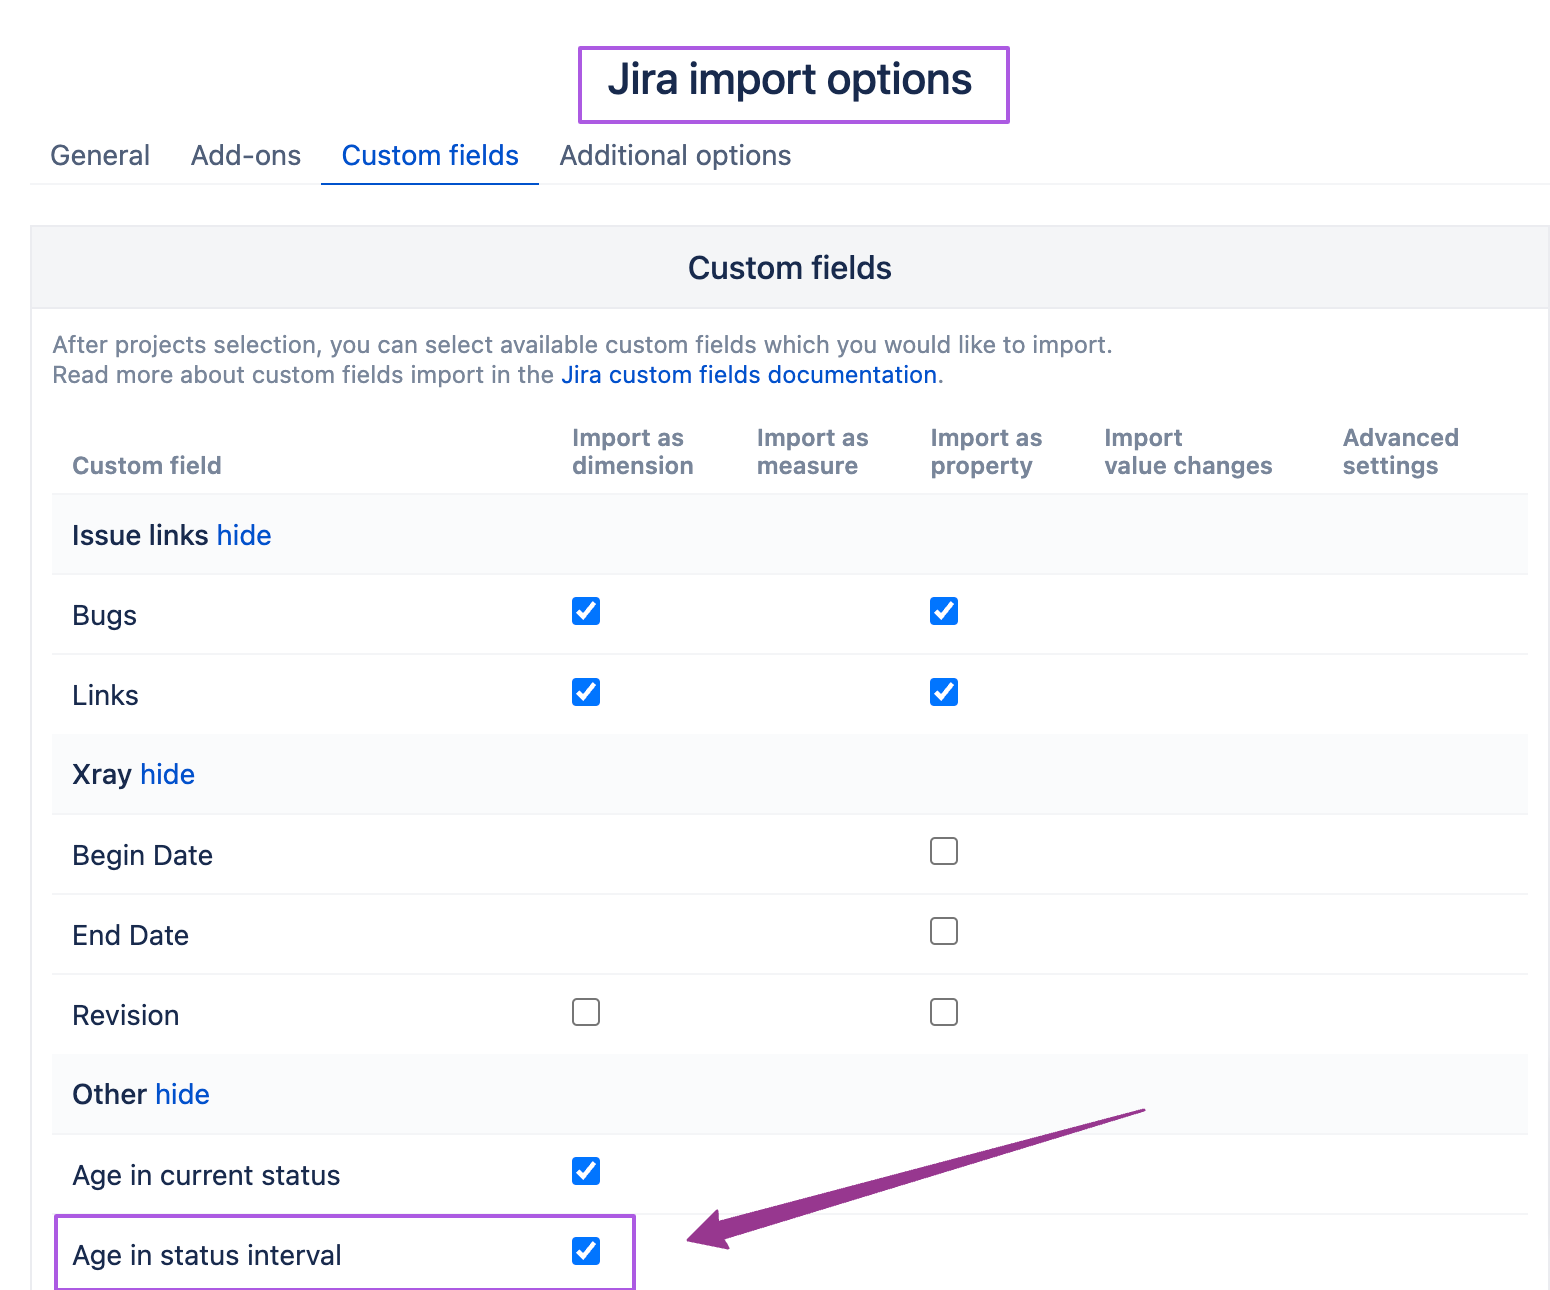
After you have updated eazyBI settings, you will need to select the newly created “Age in status interval” custom field & then do the import:
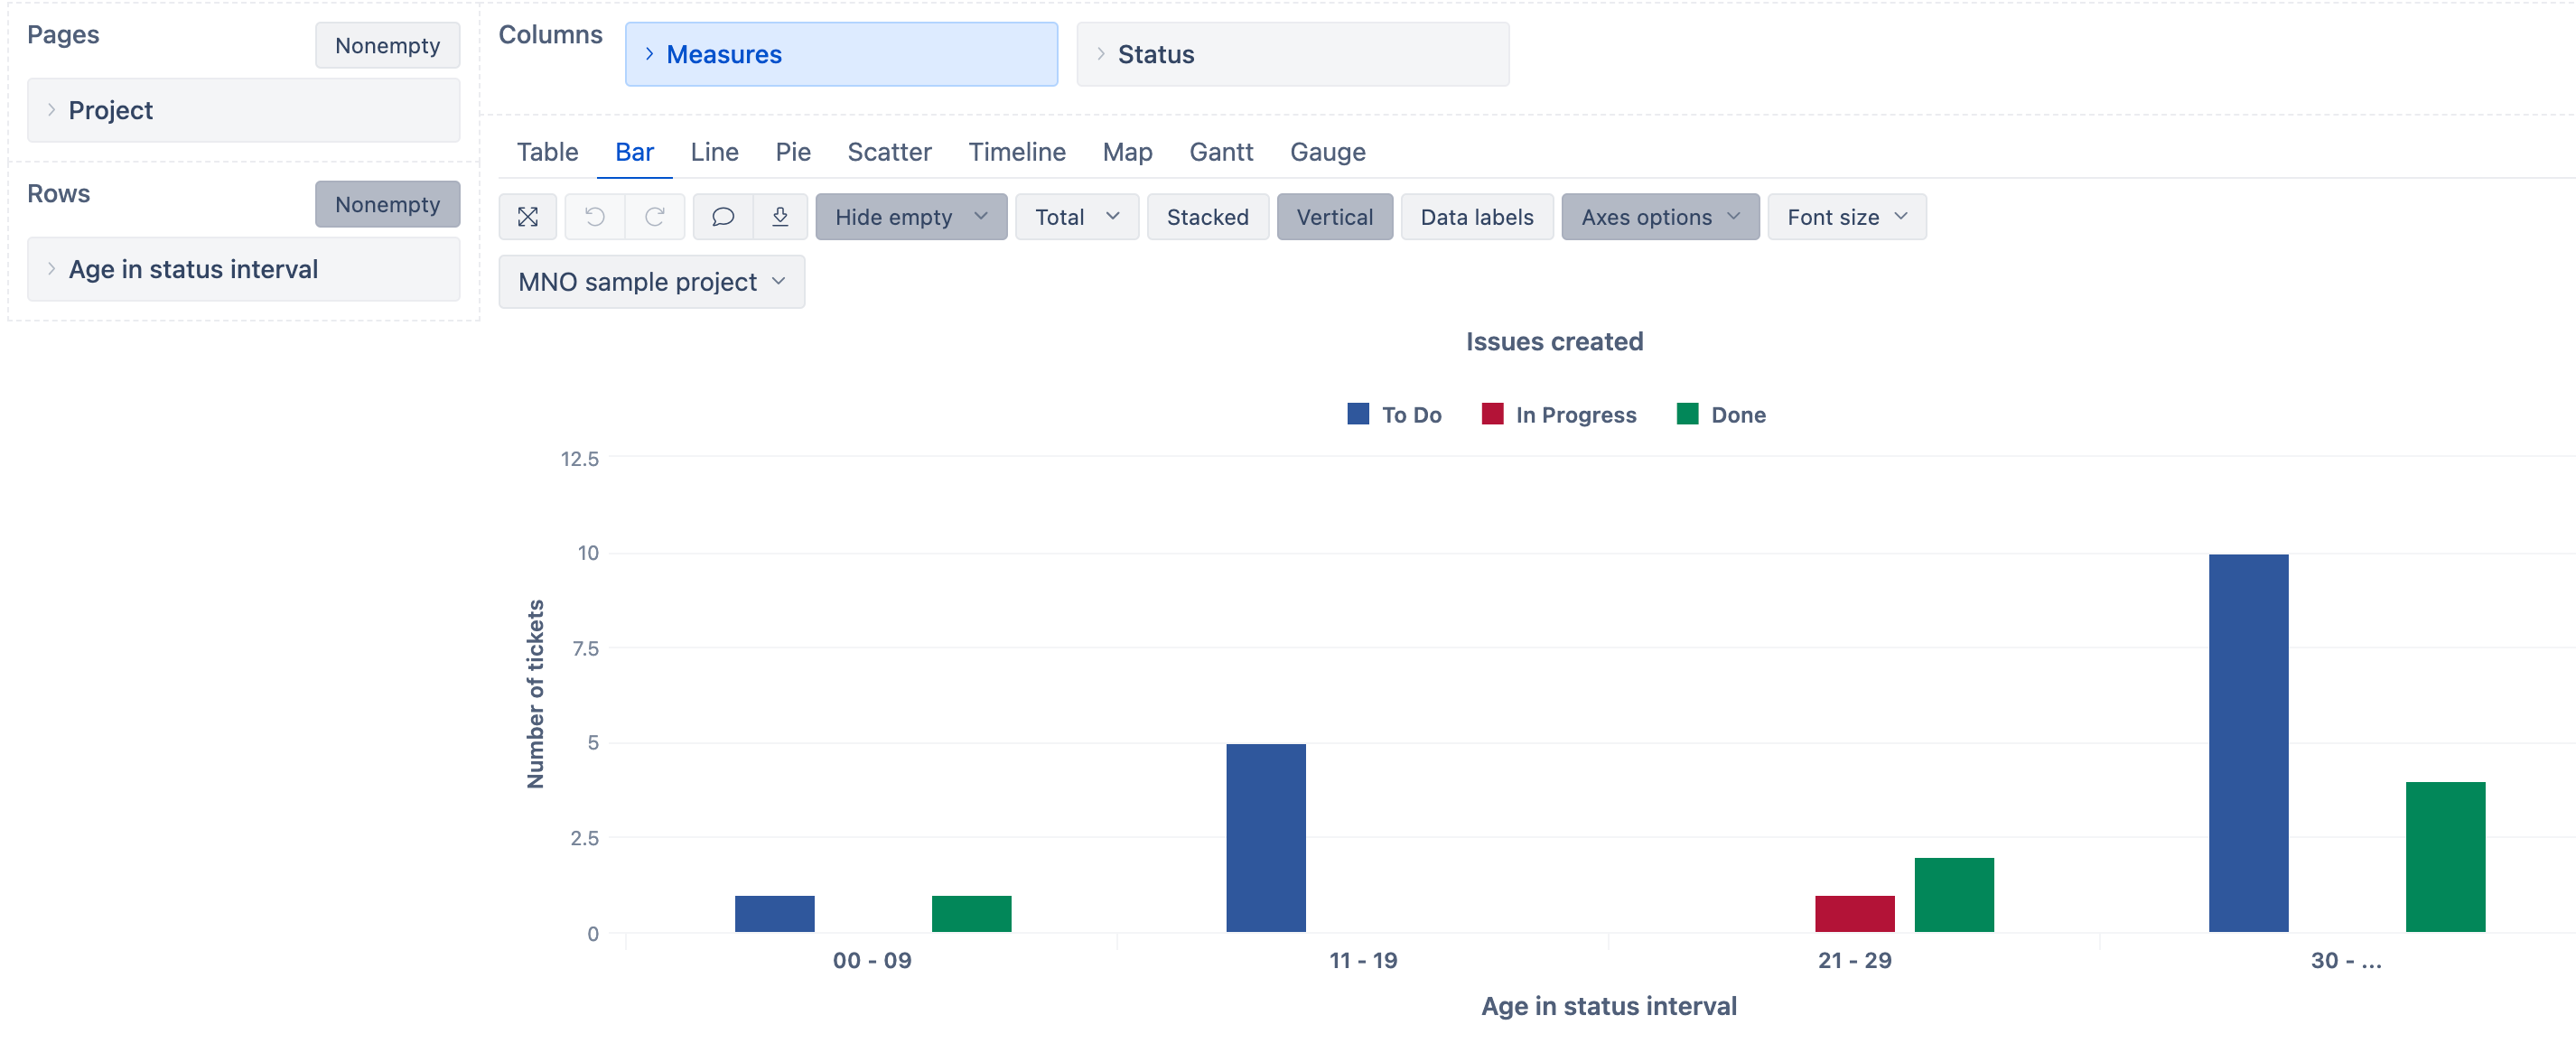
Now you can proceed to build your report by adding “Age in status interval” in the Rows, Status in the Columns and “Issues created” under Measures.
As you can see in my example below, I can see how many Issues I have in each status for how many days:
I hope this helps!
Best,
Marita from support@eazybi.com