Background information: I’m using an API pull from our Gitlab instance that gives me dates for merge created, closed and merged along with number of comments, ID, MR number, IID, and Project. It goes into a cube called ‘Gitlab’.
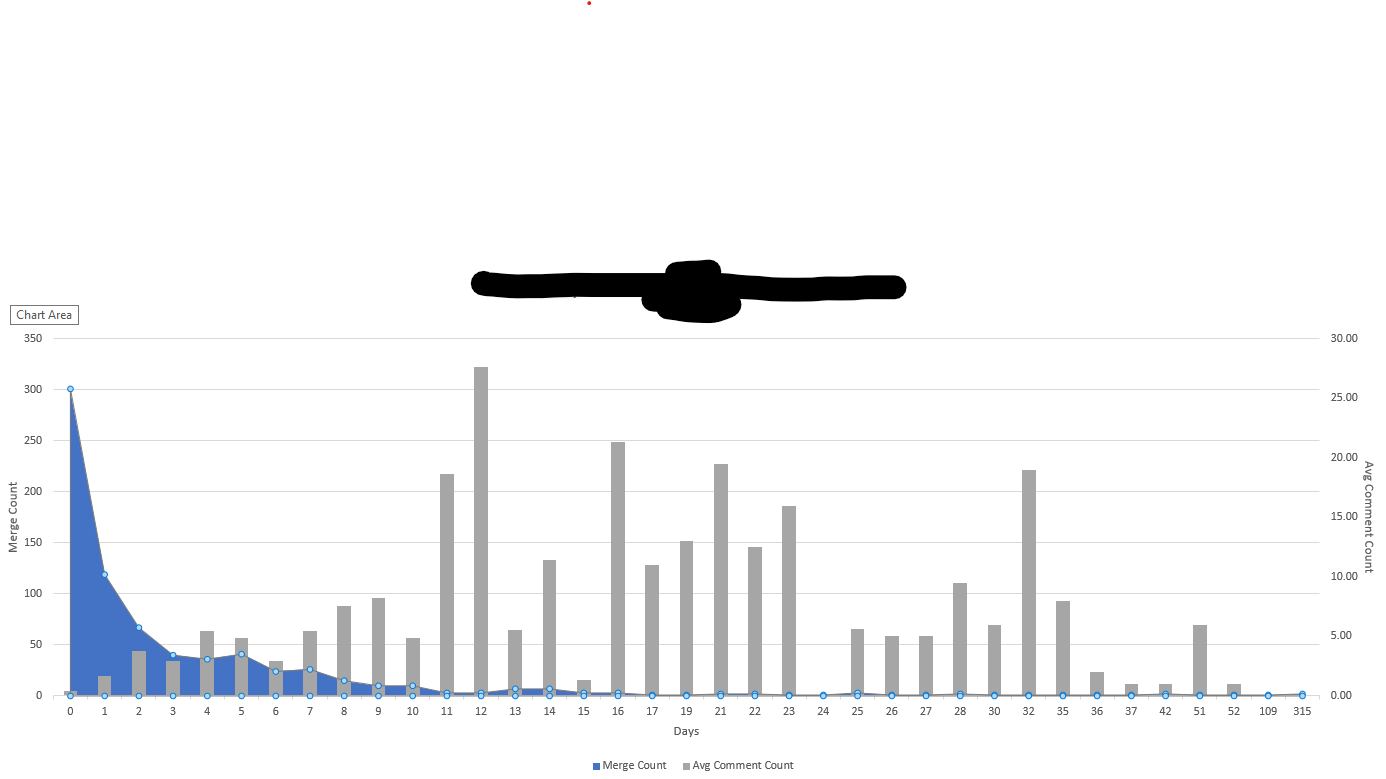
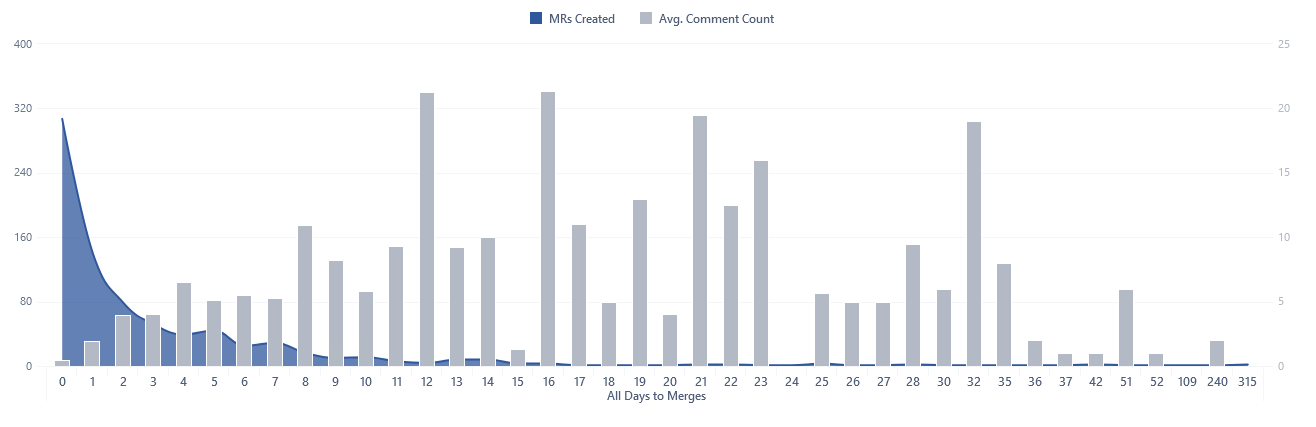
Need: I need a custom report generated that mimics the report below. The shaded area (axis #1) is a count of the number of merges that took n number of days to complete. The bars show the average number of comments associated with merges that took n days to complete.
The trouble: I can’t figure out how to get the X axis in EazyBI to dynamically display number of days between merges opening and closing. Is there a calculated member that I can use in rows that will display the desired result?
Thanks a ton for the help!!
Hi,
The custom data mapping allows the creation of calculated fields with Javascript: Data mapping.
Once you have calculated the days between MR creation and closing, you can create a dimension from the new column. This dimension on the X-axis should show the number of MRs by the number of days.
Kindly,
Janis, eazyBI support
Janis,
Thank you for the response. I have two follow on questions:
-
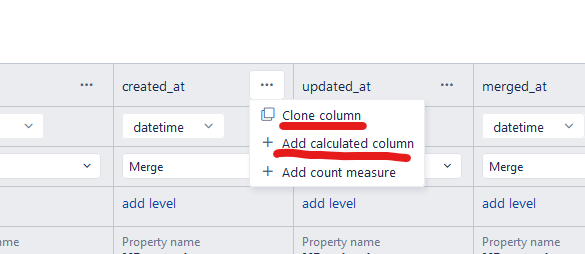
Where do I create the new column?
I see multiple possibilities. Is it cloning a column from the column mapping screen? A calculated column? Do I configure the javascript on the Content Parameters area of the REST API source parameters?
The documentation I saw seems to focus solely on the Jira import options and I can’t determine where to drop the javascript.
-
I know your job is not to teach people Javascript but I have very limited experience. Is this going to work?
[gitlab.days_to_merge]
name = “Days to Merge”
data_type = “integer”
dimension = true
javascript_code = ‘’’
if(merge.created_at) {
merge.days_to_merge =
(Date.parse(merge.closed_at) - Date.parse(merge.merged_at) - Date.parse(merge.created_at)) / 1000 / 60 / 60 / 24;
}
‘’’
time_unit = “days”
time_interval = “duration”
intervals = “0, /1”
interval_unit = “days”
Thanks again for all your help. I’ve read a ton of your replies as I’m learning EazyBI and I feel like I’m talking to a celebrity ![]() . Have a great day/weekend!
. Have a great day/weekend!
Hi Michael,
The solution is more straightforward in the custom data mapping configuration:
-
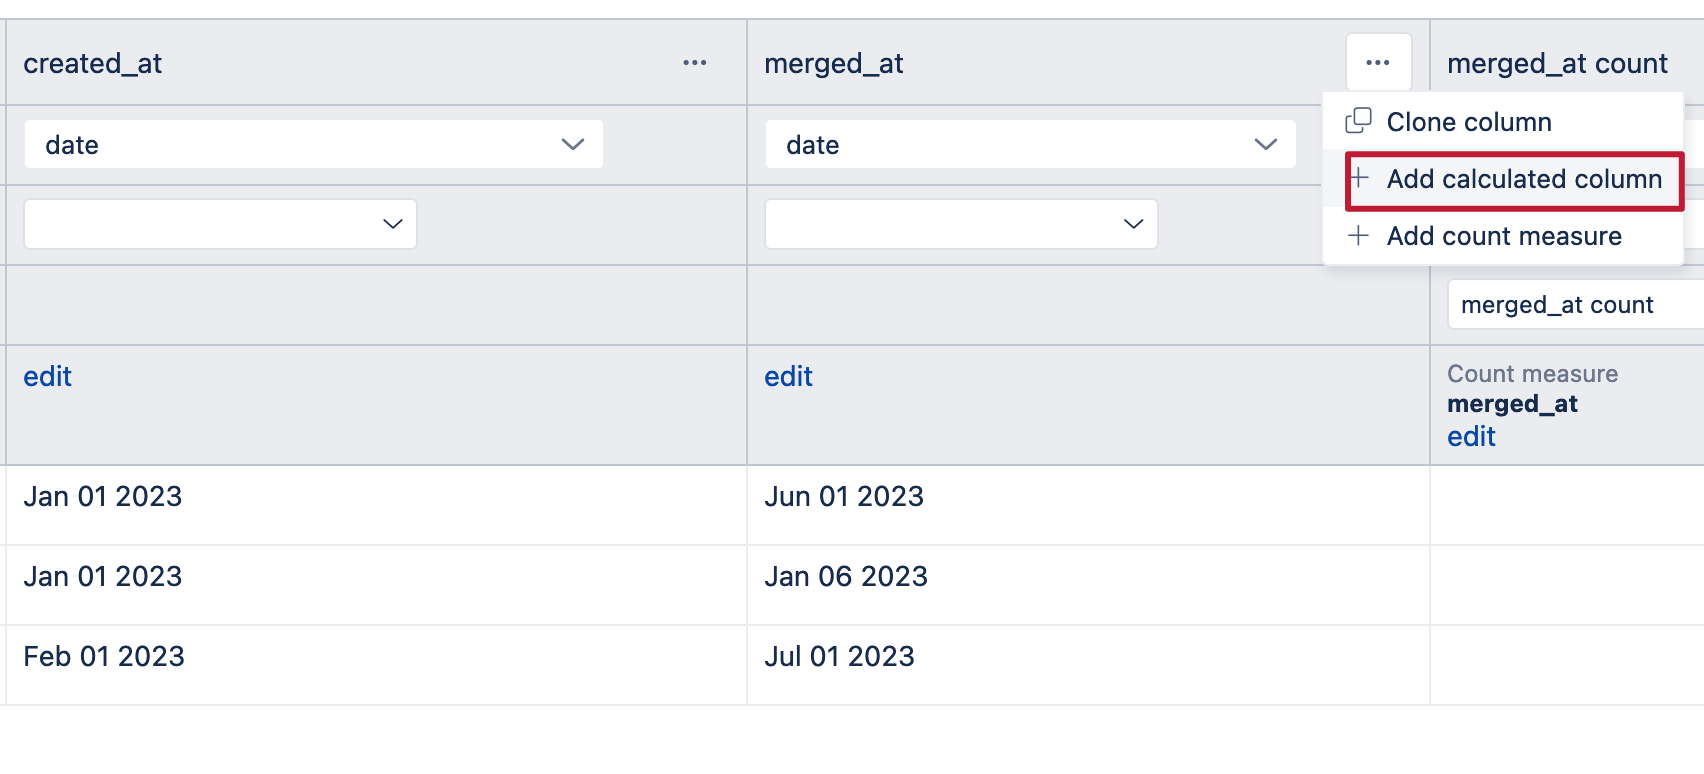
Create the calculated column:
-
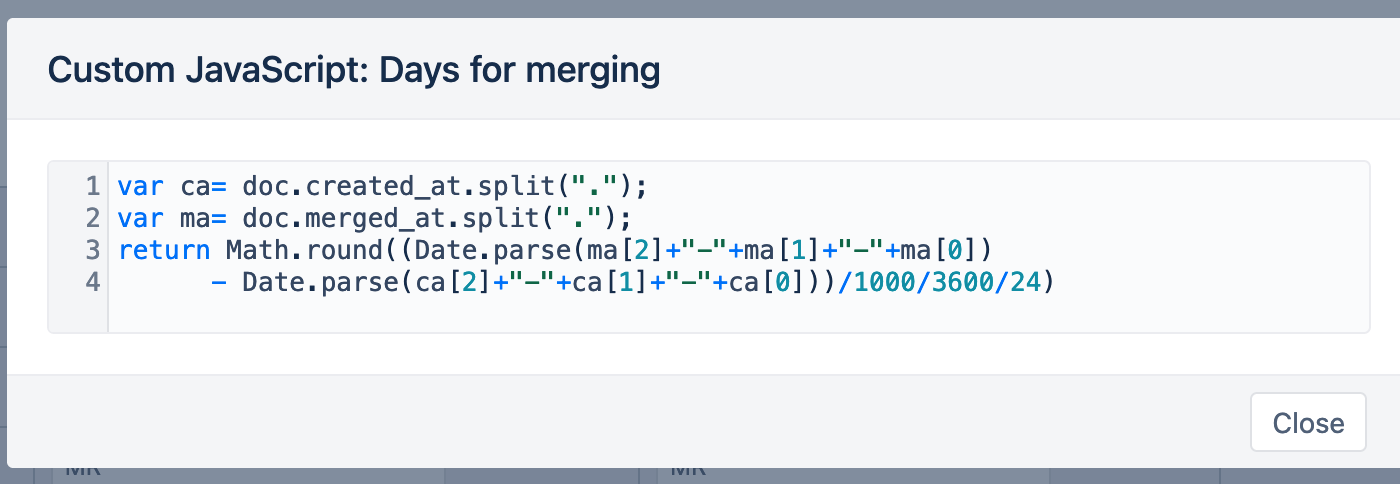
Add the custom Javascript with the following code. Note that this code is a bit tricky because the DateTime field was present in the Javascript environment as “dd.mm.yyyy” and the standard Date.parse function cannot parse this format. So, I implemented the code to re-format the date and rounded it to full days, which is more appropriate for dimension:
-
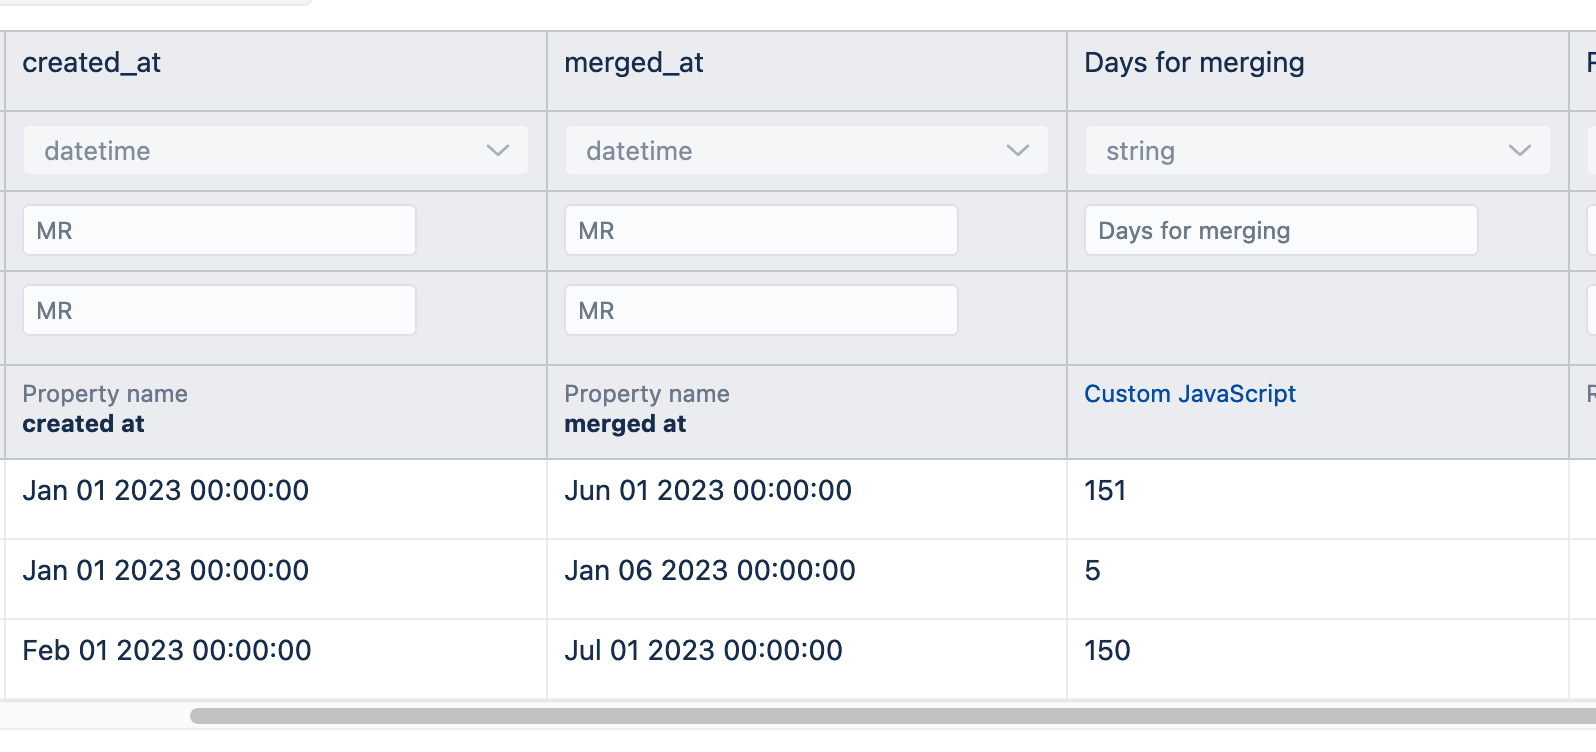
Check if the calculation works as expected:
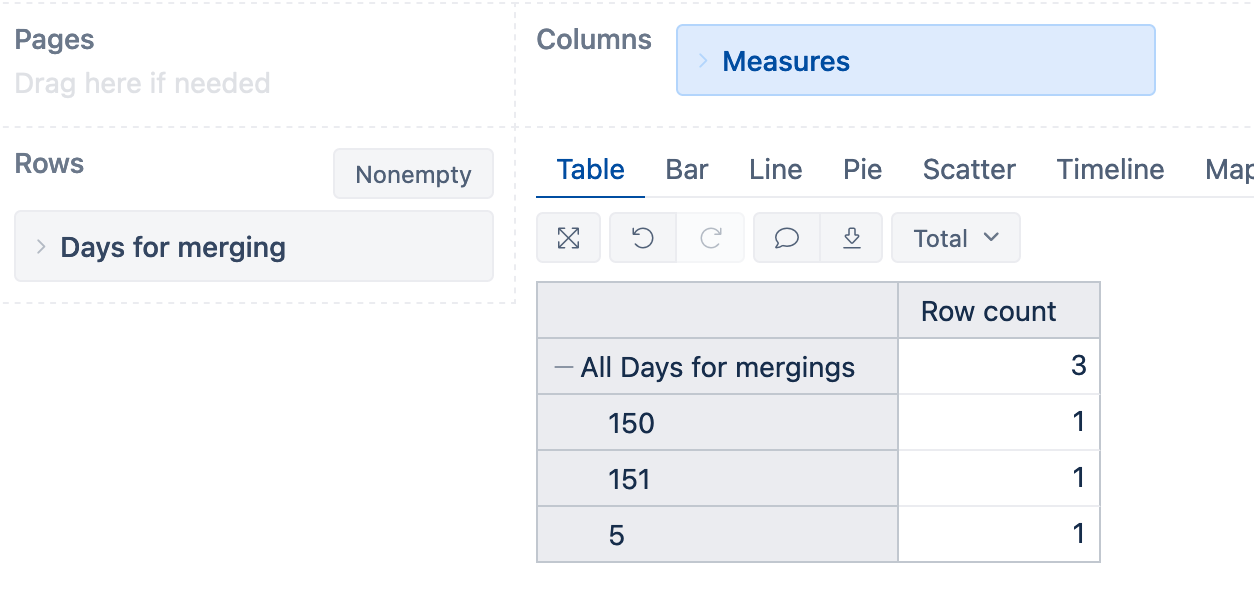
After the import, I can create a report like this:
Kindly,
Janis, eazyBI
Janis,
Thank you so much! It works great. I made some changes to the JS and I’ve noted them below if you’re curious. Couldn’t have done this without you. Tell your boss you deserve a raise.
Additional notes:
There was a third variable I needed to account for. Merges can also be closed instead of merged. So I ended up cloning the needed columns and setting them to strings (since the JS date.parse is for strings) and used the code below. Worked like a charm. I know it’s probably not the cleanest method but it served two purposes for me: learn how to clone a column in EazyBI import and write the most basic JS code possible lol. Thanks again!
“javascript_code”:
var ca= Date.parse(doc.created) || 0;
var ma= Date.parse(doc.merged) || 0;
var xa= Date.parse(doc.closed) || 0;
if(Math.round
(ma + xa - ca) / 1000 / 60 / 60 / 24) <0)
return null;
else
return (Math.round(ma + xa - ca) / 1000 / 60 / 60 / 24)}
Hi Michael,
I wonder how you managed this; “an API pull from our Gitlab instance that gives me dates for merge created, closed and merged along with number of comments, ID, MR number, IID, and Project. It goes into a cube called ‘Gitlab’.”
Can you share more information, it will be a life saver. I have tried everything to do same but couldnt make it.
Thanks
I can try to help but every instance of Gitlab is different. The hardest part of the initial setup (for me at least) was authenticating. What errors are you seeing when you try to establish the API connection? What does your Source Application Definition look like?
Hi,
I am grateful that you answered. Yes, our challenge is also authentication. Whatever I try, I get invalid URL error. easyBI IPs are already whitelisted however there is no request from these IPs on the Gitlab side.
Couple of things to try:
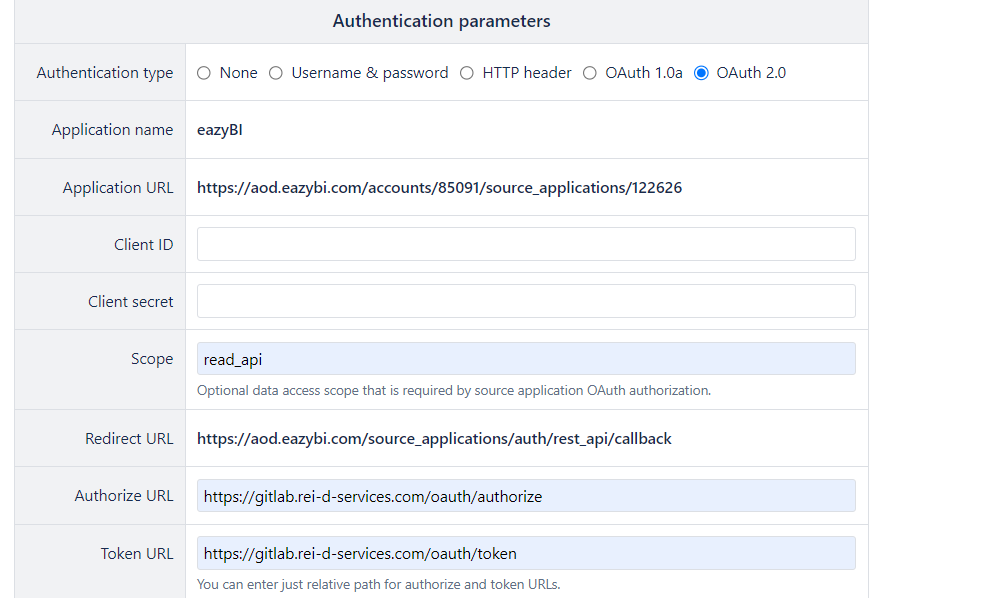
- Does your Source Data URL look like this:
https://<#YOUR GITLAB URL>/api/v4/projects/<#YOUR PROJECT #>/merge_requests - Under ‘Authentication Parameters’
a. What authentication type are you using?
If Username & Password - should be very straightforward
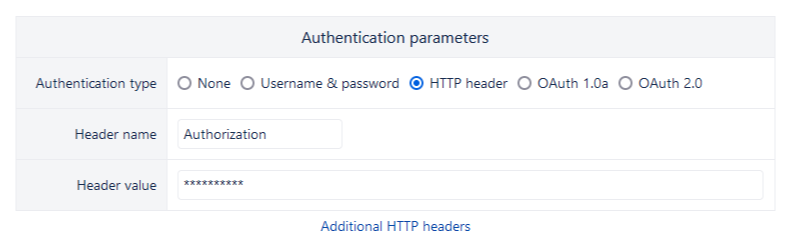
If HTTP Header:
Header name should be Authorization
Header value should be ‘BEARER <#YOUR GITLAB TOKEN>’
Please see this link to configure a Gitlab token for use.
Yes I have tried these things but I am still getting invalid URL error. The strange thing is I can get a response via Postman with same parameters but on the browser easyBI interface always shows me invalid url error
Ugh! If Postman sees it then it wouldn’t be SSRF. I found this documentation and it might help?
https://docs.eazybi.com/eazybi/set-up-and-administer/private-eazybi/advanced-settings-for-private-eazybi#AdvancedsettingsforPrivateeazyBI-EnableComicStylecharts
But, like I mentioned, if Postman is seeing the request then I doubt SSRF is blocking. I’m stumped…