Hello,
I am created a new report that has Project and Time as pages and Sprint as Rows.
I need to add Measures to this report based on the values of an dropdown field in the Issue.
E.g. Field is called Issue Category and Values are A, B, C
I need to add columns A, B, C where the sum of completed story points is displayed based on the issue category.
E.g. SUM( IIF(issue category = ‘A’, completed story points, 0) )
You may want to import the custom field “Issue Category” as a dimension in the eazyBi: Data from Jira
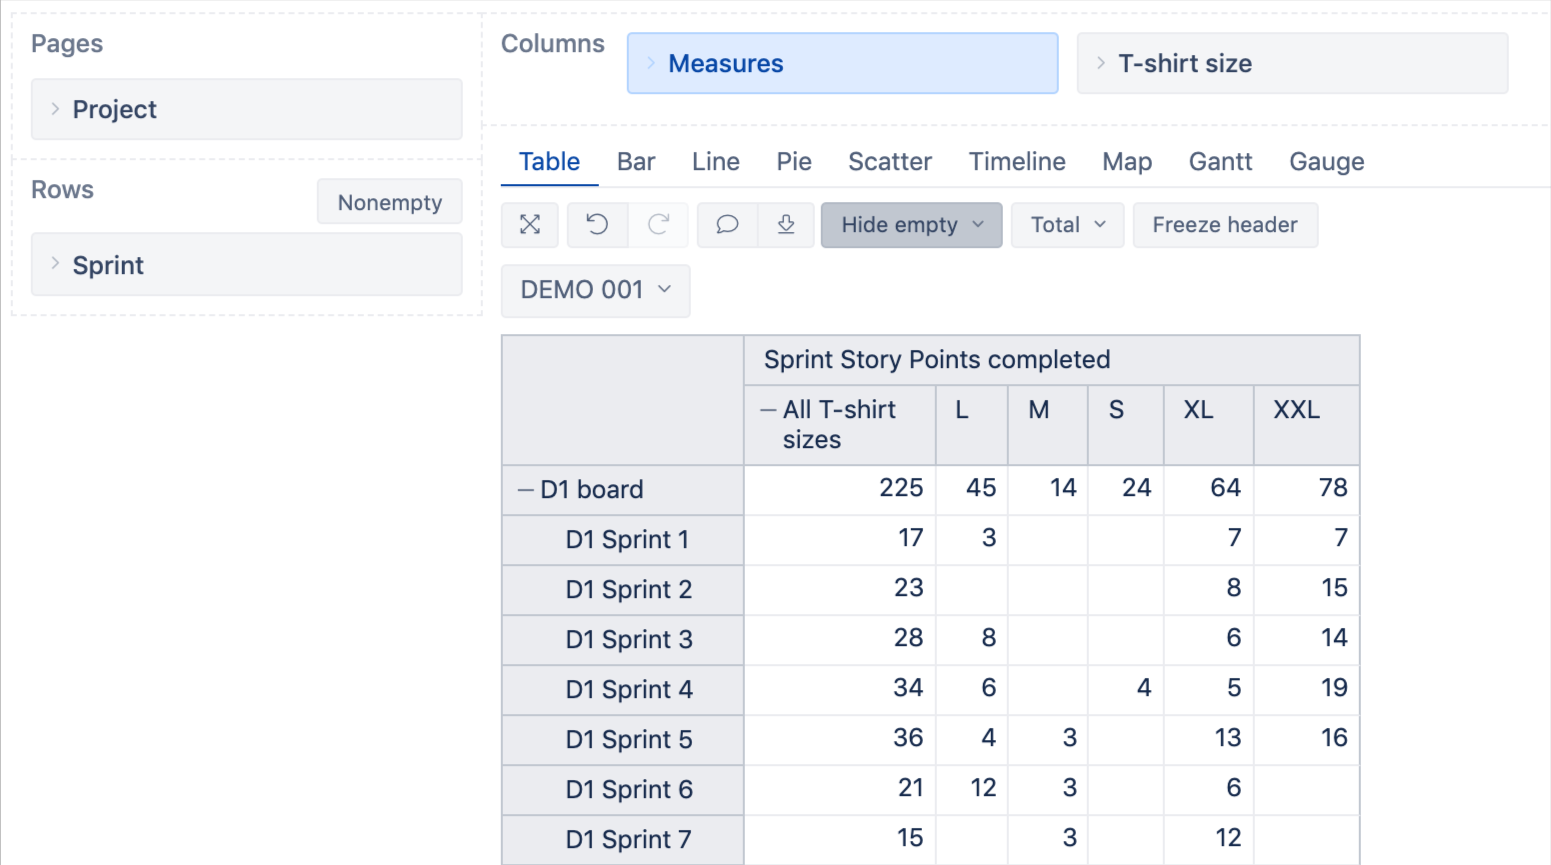
Then, in the report with Sprints in rows and measure “Sprint Story points completed” in columns, add this “Issue Category” dimension also in columns and expand. Now, all completed story points will be split and summed up by issue categories.
See example below (custom field “T-shirt size” is used instead of “Issue Category”):
Wow! Thank you. This was super simple.
One additional question. I have selected Sprint in the “Rows” section. I also selected “All Closed Sprints”. But my report still shows current open sprints and even future sprints. Please help in this too?
Hi Ilze,
One more question. In my case the text for L, M , S, XL, XXL is very long and the report does not look presentable. Is there a way to customize that?
E.g. change “Product Initiatives - includes bugs tied to these projects as well as team level features” to “Product Initiatives” ?
Dimension member names are always the same as values in the corresponding custom field in Jira.
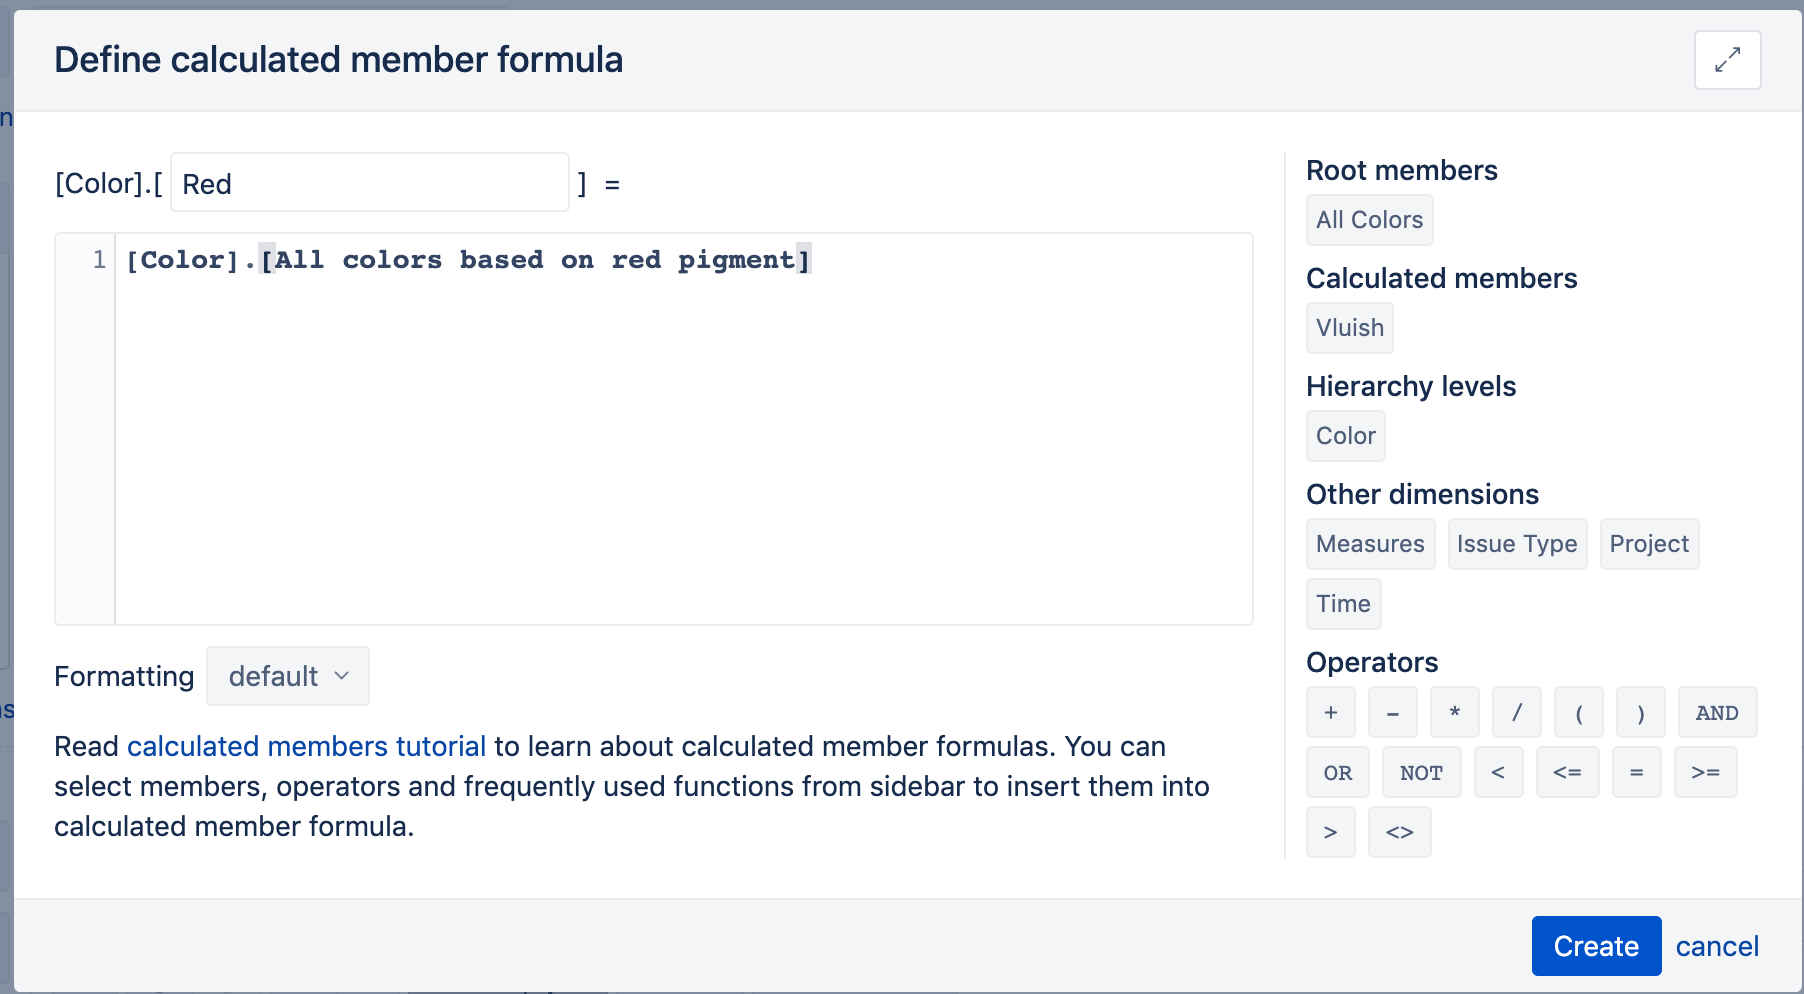
If you have a few values in this dimension, you may create a calculated member for each of them in this same dimension and name the calculated member with the short name. Then select in the report those calculated members, and their names will be displayed in the chart.
See an example below. I have a long name for a member in the Color dimension: the original member name is “All colors based on red pigment” and thus I create a calculated member in the Color dimension and name it shorter (Red).
Probably, you already had selected All Sprints member or just all sprints in the report rows, and then added “All Closed Sprints”. Closed sprints were shown additionally to all sprints, not substitute them.
Ensure unselecting all sprints. The easiest way is to select again “All Sprints” member, expand and collapse it and then remove (unselect). After that (when the report rows are empty), select “All Closed sprints”. Now expanded it should contain only sprints which are closed.
If it does not help and you still see future or active sprints, please contact support@eazybi.com