A higher than epic hierarchy called Requirement was created
Request
epic
user story
Task
subtask
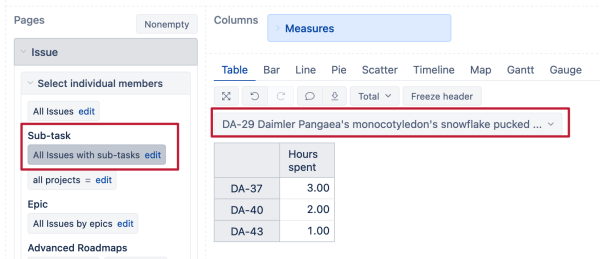
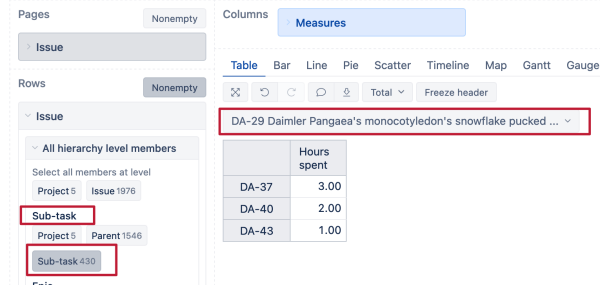
The hours are allocated at the level of User Stories, task, subtask etc.
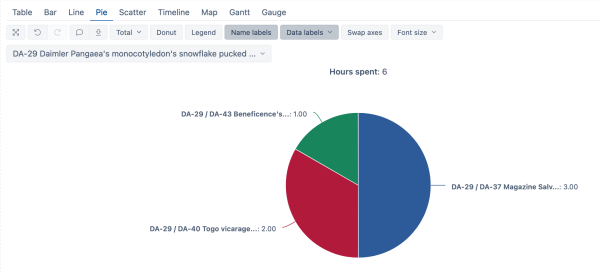
When building a pie chart and we want to see the hours allocated to the requirements, we find ourselves with the problem that it does not show us anything, since the hours are allocated to the daughters and are not reflected in the father.
The question is, if there is a way to create a Pie type graph that reflects the parent issue showing information of hours allocated to the child issues. In other words, as if the parent issue (Requirement) had the hours of the daughters (Tasks) assigned.
I am attentive to any comment, thank you