Created total data in timeline chart

I want to make this table.

bbb I want
Jun-20 Test 164 277
Jul-20 Test 174 277
Aug-20 Test 174 277
Sep-20 Test 174 277
Oct-20 Test 178 277
Nov-20 Test 179 277
Dec-20 Test 251 277

Please tell me how I can make total sum data for all time.
(I already know “add calculated > Statistical > Max” make it.
But I want make that by using query in “Measures”.)
Thanks.

Hi @1115 ,

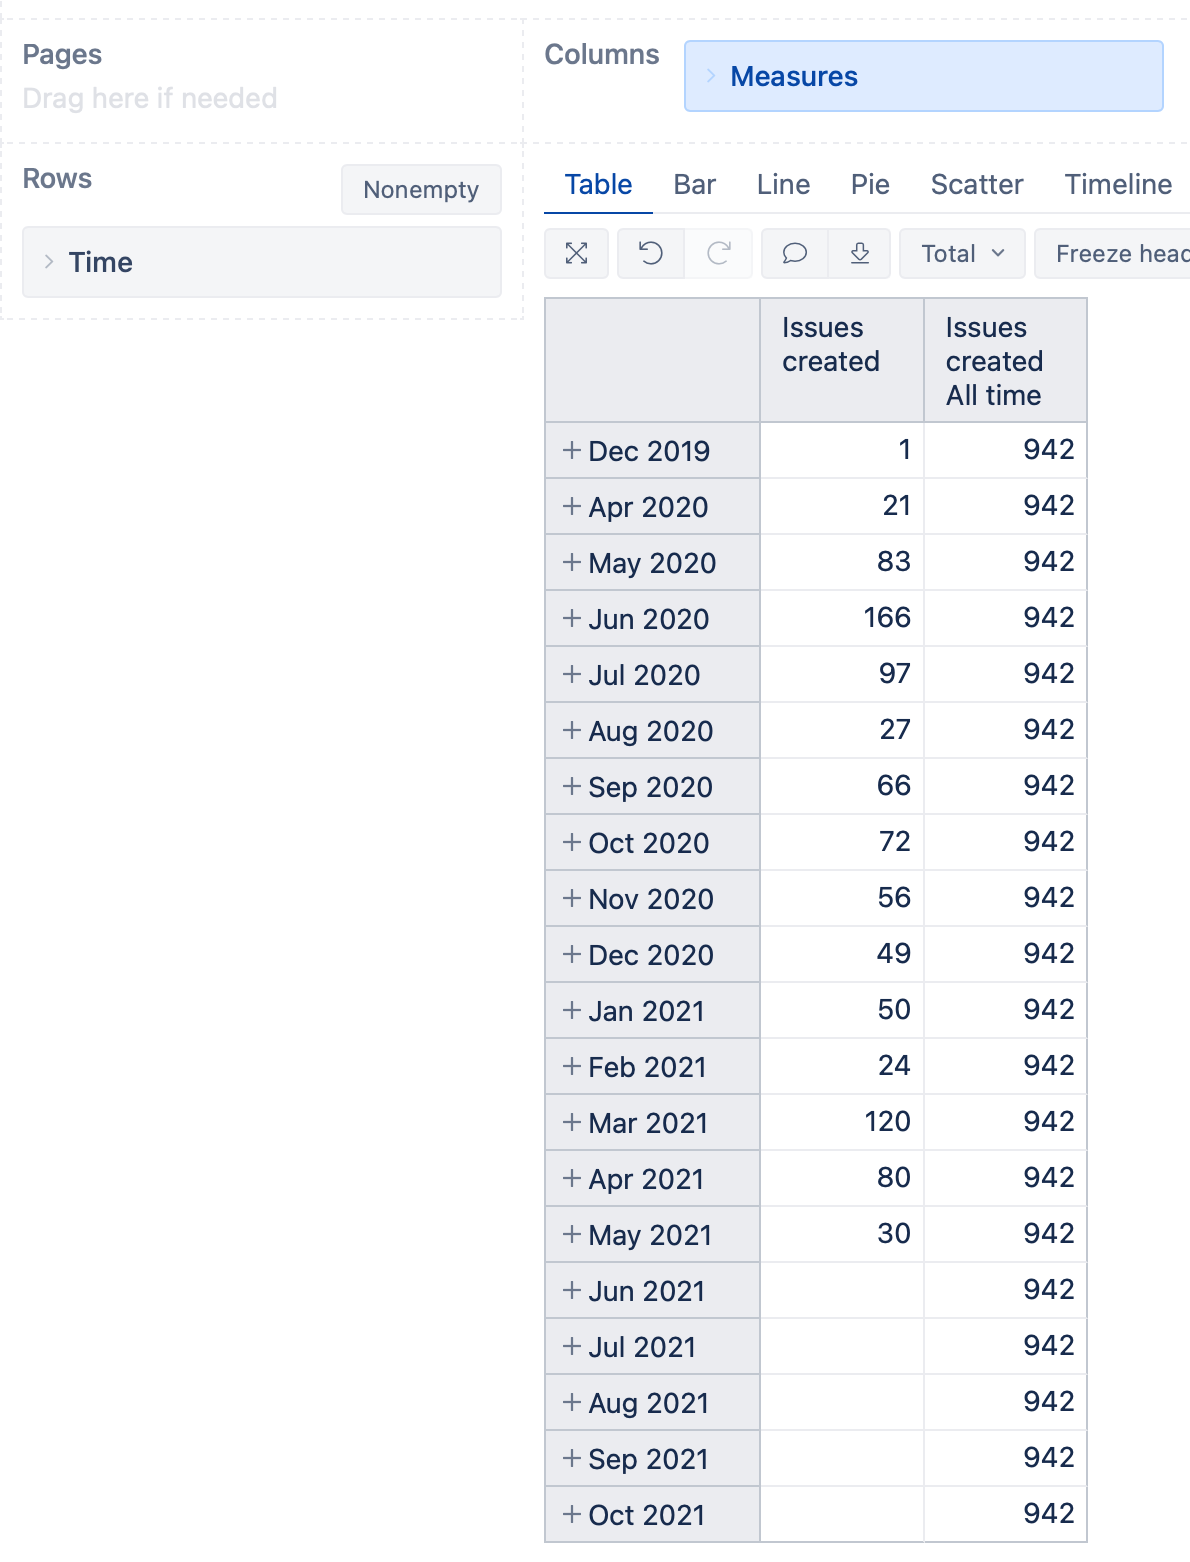
You can try defining a new calculated measure that forms a tuple of the desired measure and the Time dimension current hierarchy default member. For example, with the measure “Issues created”, the formula could look similar to the one below:

([Measures].[Issues created],[Time].CurrentHierarchy.DefaultMember)

Please see the eazyBI documentation page for more details on tuples - Calculated measures - eazyBI.

Best,
Roberts // support@eazybi.com

Thank you for your help @roberts.cacus !