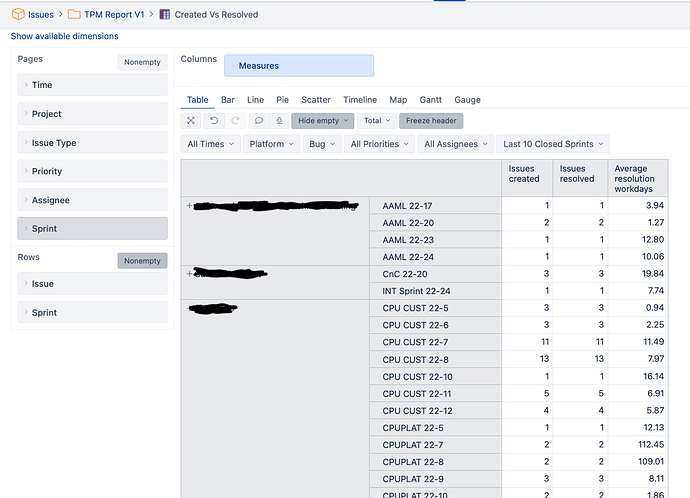
Hi, I am trying to generate a create vs resolved table for all my projects based on the last 10 closed sprints by board and i am getting the issues created and resolved count as the same number. Below is the calculated member used for Last 10 closed sprint. Not sure why i am not getting the right numbers in the table as the values are accurate for active sprints and all sprints.
Aggregate(
  Generate(
  -- get all boards
    [Sprint].[Board].Members,
    -- access all children - sprints from the board and get the last 10 closed
    Tail(
      Filter(
      [Sprint].CurrentMember.Children,
      [Sprint].CurrentMember.GetBoolean("Closed")),
      10)
  )
)
Hi @Balaji_Ravichandran ,
If you wish to compare issues committed versus issues completed within the sprint, I suggest using Sprint Scope measures: Jira Software custom fields
“Sprint issues commited” shows count of issues assigned to a selected sprint at the moment when the sprint was started. And “Sprint issues completed” shows count of sprint completed issues at the moment when the sprint was closed.
Here you can see report using those measures: Sprint issue balance - Issues - Jira Demo - eazyBI
Measures “Issues created” and “Issues resolved” are currently assigned to the sprint. If the sprint has been completed, then only issues resolved during that sprint would still be counted to the sprint. And vice versa: if the issue was not resolved during the sprint, even if it was in that sprint, it won’t be counted against. Read more here.
best,
Gerda // support@eazyBI.com
