I’m trying to make what should be a simple bar/line chart showing Created vs. Resolved Issues over time. The problem is that my group does not use “resolution.” We only track issues using workflow status: To Do, In Work, On Hold, Done.
Since Jira doesn’t know when an issue is “resolved,” I can’t figure out how to mimic the eazyBI standard chart for created vs. resolved issues, but using transition status instead of “resolution.”
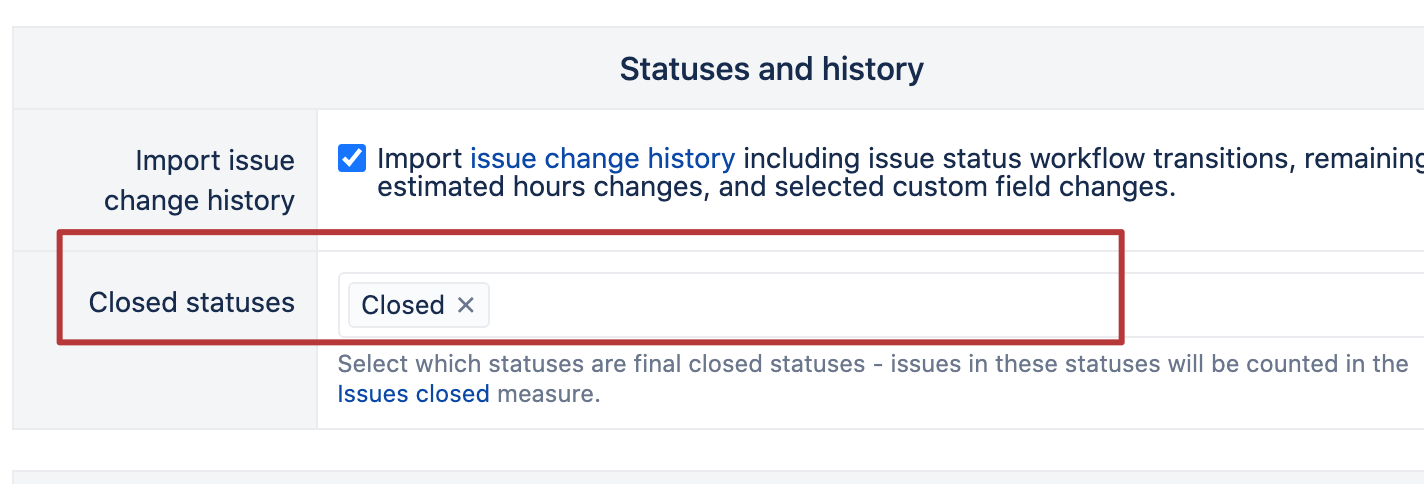
My data source has correctly identified the status that are “done” and does import those. I just can’t see how to use existing, or create new, measures to show what looks like the attached.