Hey everyone,
I have a custom field called “Integration State” which I am using to indicate if a test in JIRA/Zephyr is “Automated” or “Not Automated”. I want to create a chart that displays the number of tests per quarter where the “Integration State” field was changed to “Automated”. How do I go about doing that? I’ve tried many ways and haven’t found success yet.
Hi @madygardner
Welcome to eazyBI community
In order to import changes for custom fields, it must be defined accordingly (via eazyBI advanced settings with additional lines)
changes = true
separate_table = true
Next, you could open import options and import changes for custom field “Integration State”.
After that, you can create a new calculated measure to calculate the number of tests which were transitioned to “Automated”
Try this code:
(
[Issue Type].[Test],
[Measures].[Transitions to issues count],
[Transition Field].[Integration State],
[Integration State].[Automated]
)
Please also read the documentation page about Zephyr integration
https://docs.eazybi.com/eazybijira/data-import/data-from-jira-and-apps/zephyr-for-jira-test-management
Martins / eazyBI support
Hey Martins,
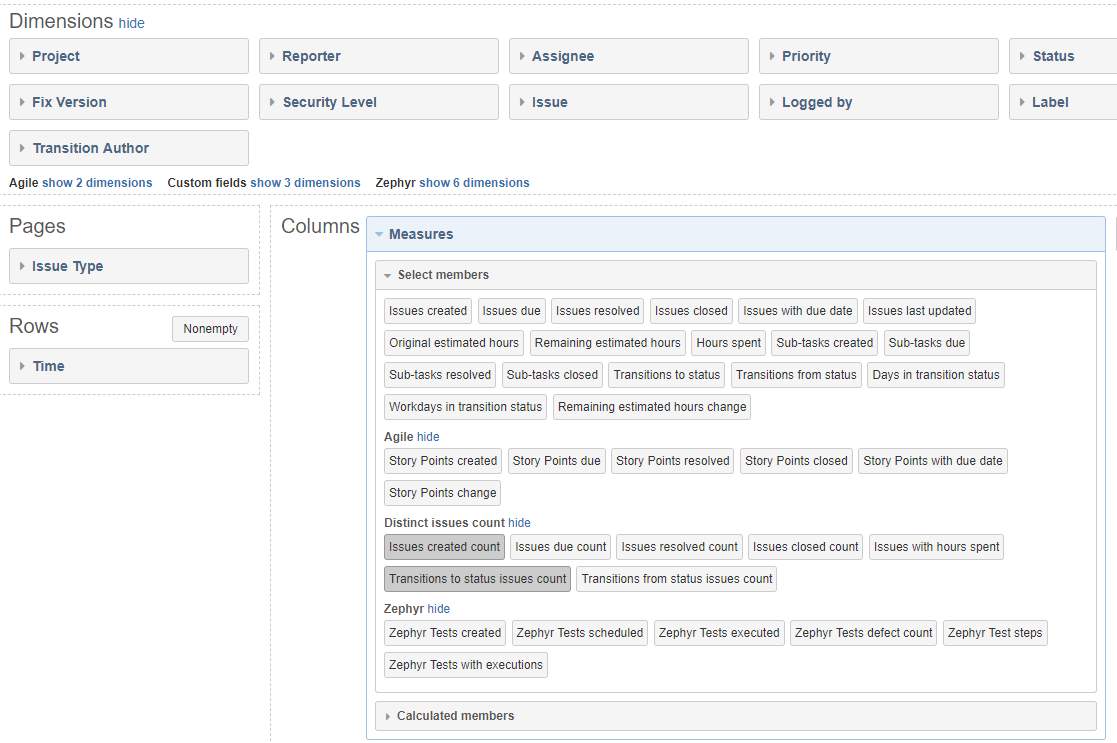
I noticed that in the code you have [Measures].[Transitions to issues count] but I don’t see this option under Measures - Select Members. I did ask the support team to make those import changes for the custom field already and have created the new calculated member under “Measures” but it looks like it won’t function unless I have a “Transitions to issues count” select member? Is that correct? If so, how can I have the support team create that select member? See attached image of the current select members that exist.
Hi,
Very good question.
A measure “Transitions to issues count” is a hidden measure which can’t be selected from the “Measures” dimension but it still exists and you can use it for custom calculations.
Try using this measure in your calculated measures.
Martins / eazyBI support
Hello,
Ok thank you for the information! Then if I have the calculated member defined as you’ve written out then I do not need to choose any “Select member” for my chart to work? I can just have the calculated member selected for my Measure and then have “Issue Type” in Pages and “Time” in Rows and it should work?
Hi,
Yes, that is the idea.
Since the calculated measure also has an Issue Type dimension member in it, you can skip using “Issue type” dimension for your report.
Martins / eazyBI support
Everything works perfectly for what I needed, thank you!!
One additional question. Of the tests that were changed to “Automated” in each quarter, is there a way that I can add another qualification to only display those that still are marked as “Automated”.
I.e. I have 5 tests that I marked as Automated in 2019Q3 but now only 1 of those is still marked as Automated.
Hi,
In that case, the code is little bit more complex:
It would filter based on same condition but only among issues that has currently inegration state “Automated”
NonZero(
Count(
Filter(
Descendants([Issue].CurrentHierarchyMember,[Issue].[Issue]),
[Measures].[Issue Integration State] = "Automated"
AND
(
[Issue Type].[Test],
[Measures].[Transitions to issues count],
[Transition Field].[Integration State],
[Integration State].[Automated]
)>0
)
)
)
Martins / eazyBI
That did exactly what I was looking for, thank you again!
Hi Martins, I am hoping you can help me decipher how to calculate something similar. I have a field titled “Deposit” in which Pending, Submitted or Not Required can be selected. How would I create a measure to calculate the duration in days that each issue in my project has “sat” in each value of “Deposit”?
@mhoglund2
You would need to import changes for the single select custom field using advanced settings
https://docs.eazybi.com/display/EAZYBIJIRA/Advanced+settings+for+custom+fields#Advancedsettingsforcustomfields-Importchangesofcustomfielddimensions
Then you could try creating calculated measures using MDX and use the first and last timestamp when the field was changed and calculate the duration between the first time issue got the particular Deposit value and the last time it went out from that value.
See more about issue change history import here:
https://docs.eazybi.com/display/EAZYBIJIRA/Import+issue+change+history
You could also consider importing new pre-calculated field “Days in Deposit” using Javascript.
See similar use-case here: Help - Need calulated measure(s) for Counting changes in Issue "Types" - #3 by zane.baranovska
Martins / eazyBI