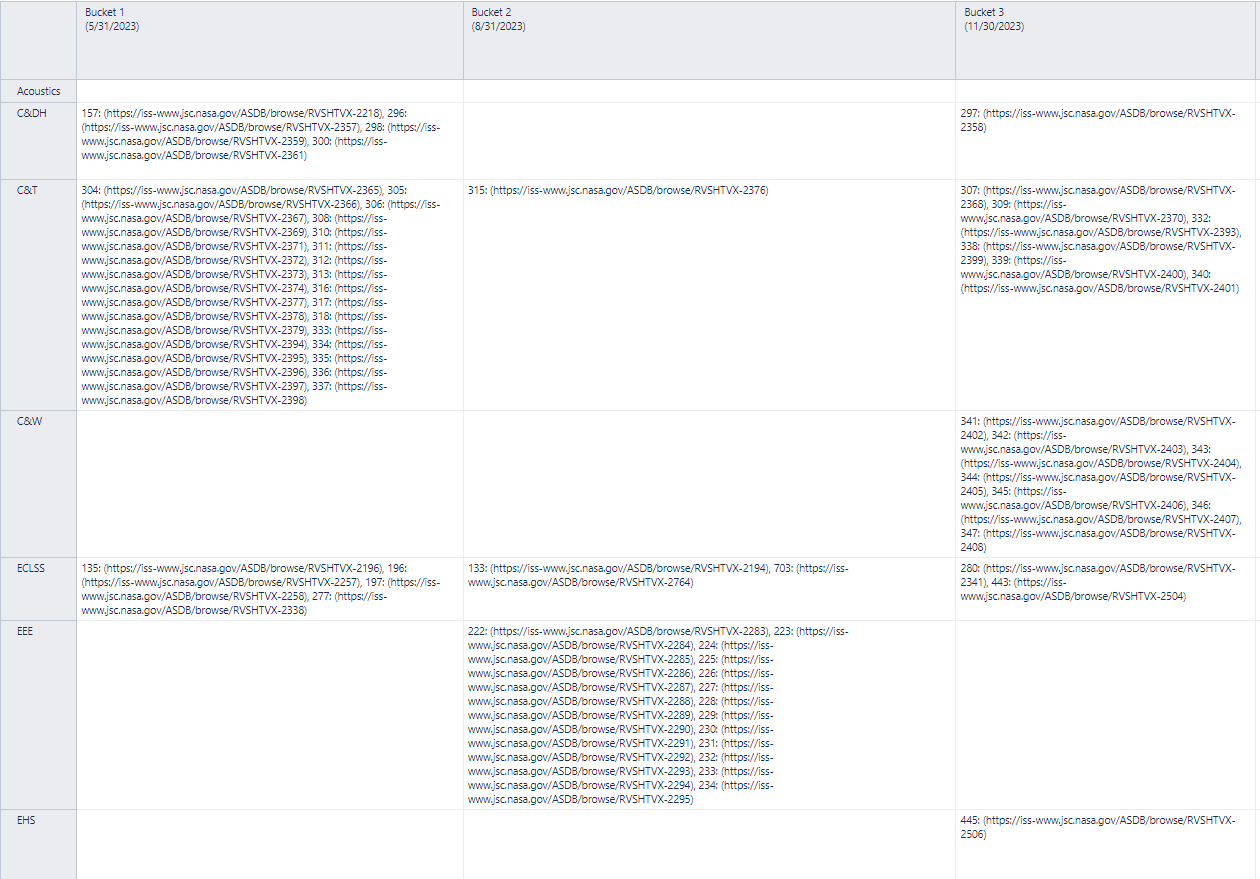
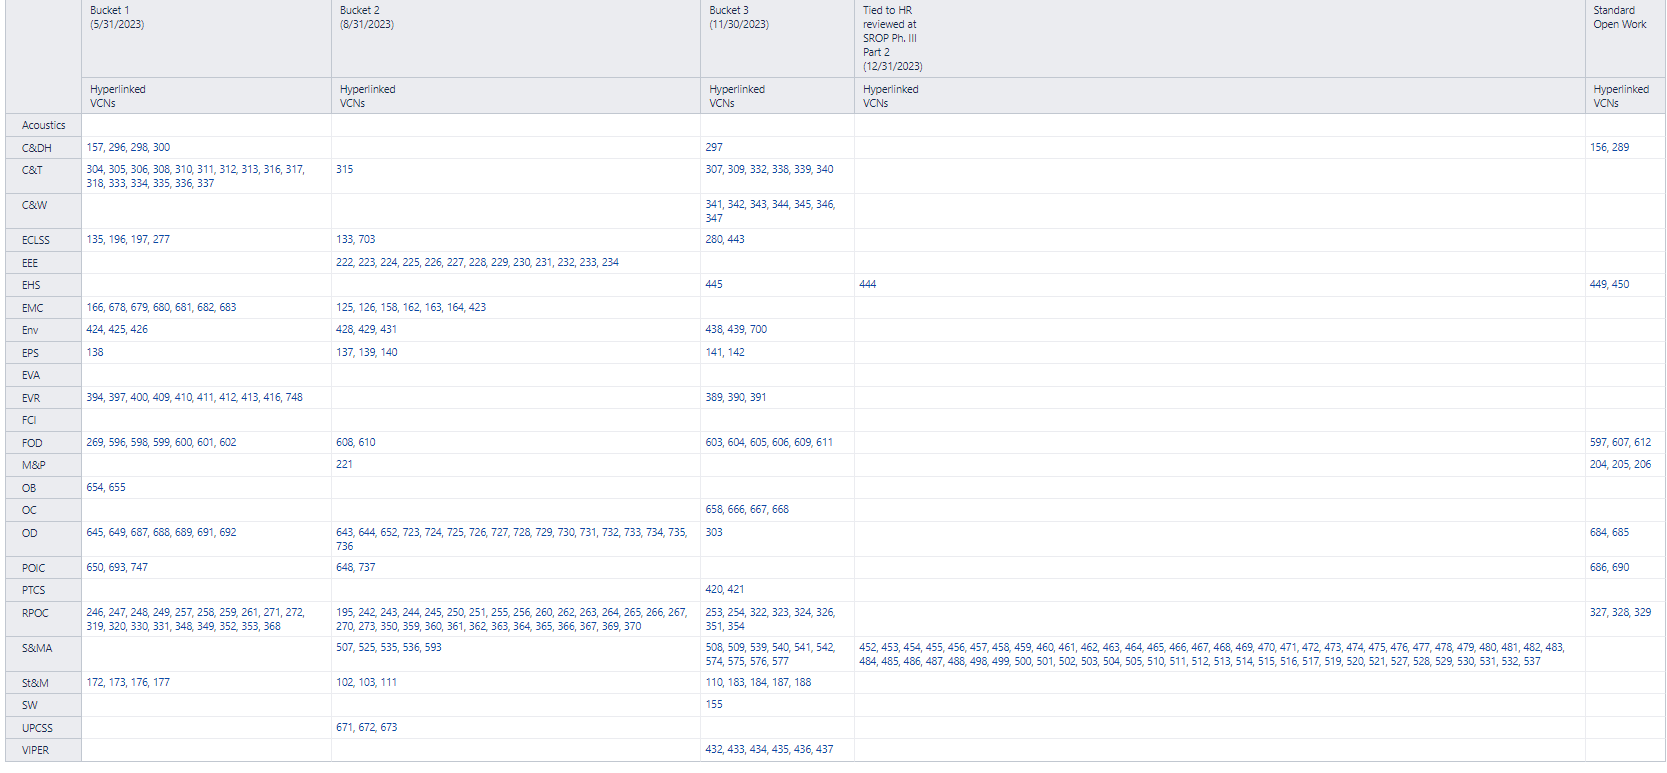
I am working on a chart that has RO’s as rows and Buckets as columns, then VCN ID’s listed in their respective cells, separated by commas, and each VCN ID hyperlinked. I just cannot get them hyperlinked, I was able to display the link but it’s like EazyBI will not read the links correctly, wondering if this is because EazyBI will not register multiple links in the same cell?
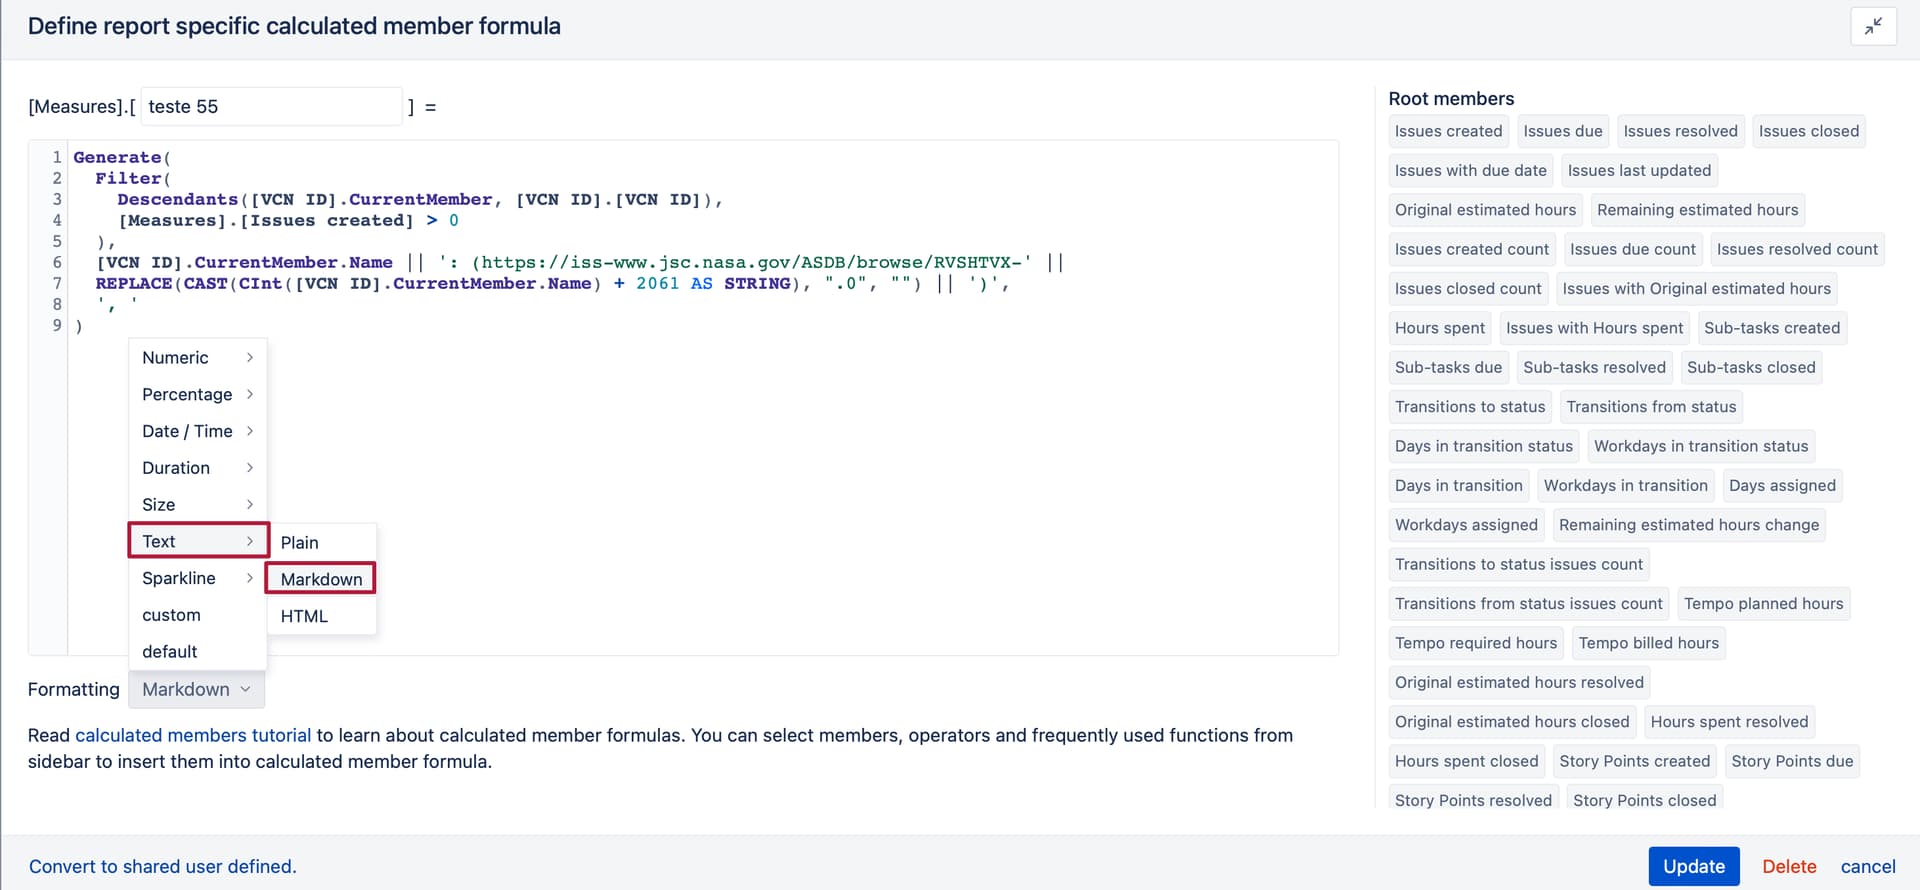
I am using the code below for my calculated member and have it formatted as a Markdown, but no luck whatsoever getting each listed issue hyperlinked. Please help!!!
Generate(
Filter(
Descendants([VCN ID].CurrentMember, [VCN ID].[VCN ID]),
[Measures].[Issues created] > 0
),
[VCN ID].CurrentMember.Name || ‘: (https://iss-www.jsc.nasa.gov/ASDB/browse/RVSHTVX-’ ||
REPLACE(CAST(CInt([VCN ID].CurrentMember.Name) + 2061 AS STRING), “.0”, “”) || ‘)’,
', ’
)