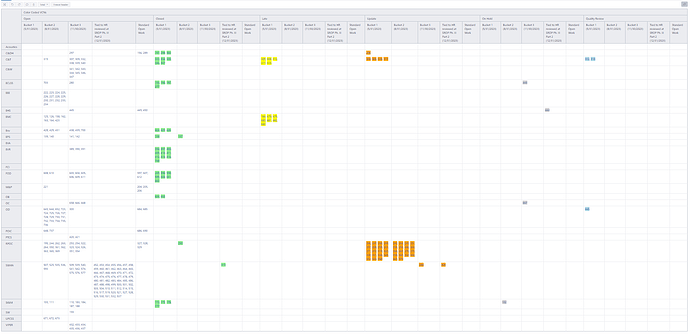
I want to compile all VCN’s into their respective cells based on buckets (Columns) and RO’s (rows), while still being color coded based on their status. Nothing shows up in the “all status” category, and when I remove status from columns, I am met with a “null” for each VCN ID (numbers). Please help! See the current user defined member code below. I had to manually input the links as the VCN IDs are linked to (https://iss-www.jsc.nasa.gov/ASDB/browse/RVSHTVX-xxxx) and the xxxx key does not match up to the VCN ID, so if there is a better way to link these please help with that too. As when I create a list of issues, separated by commas in the same cell, EazyBI seems to have trouble with automated links.
But my main concern is eliminating the separate status columns and compiling all color coded VCN ID’s under one “all status”, as the table is way too large on a computer screen to have each individual status showing.
