Hi, I’m fairly new on EazyBi, I’m trying to create this graph by drawing a horizontal line or area representing the percentile on the bar graph. My understanding is the best way to do it is to create the same calculated measure result on all rows.
In other graphs, I was able to do this using the VisibleRowSet()
Calc Measure from another graph:
CASE WHEN NOT IsEmpty(Cache([Measures].[Tempo de entrega (cycle time)])) THEN
  Percentile(
    VisibleRowsSet(),
    [Measures].[Tempo de entrega (cycle time)],
    50
  )
  ELSE
  NonZero(0)
END
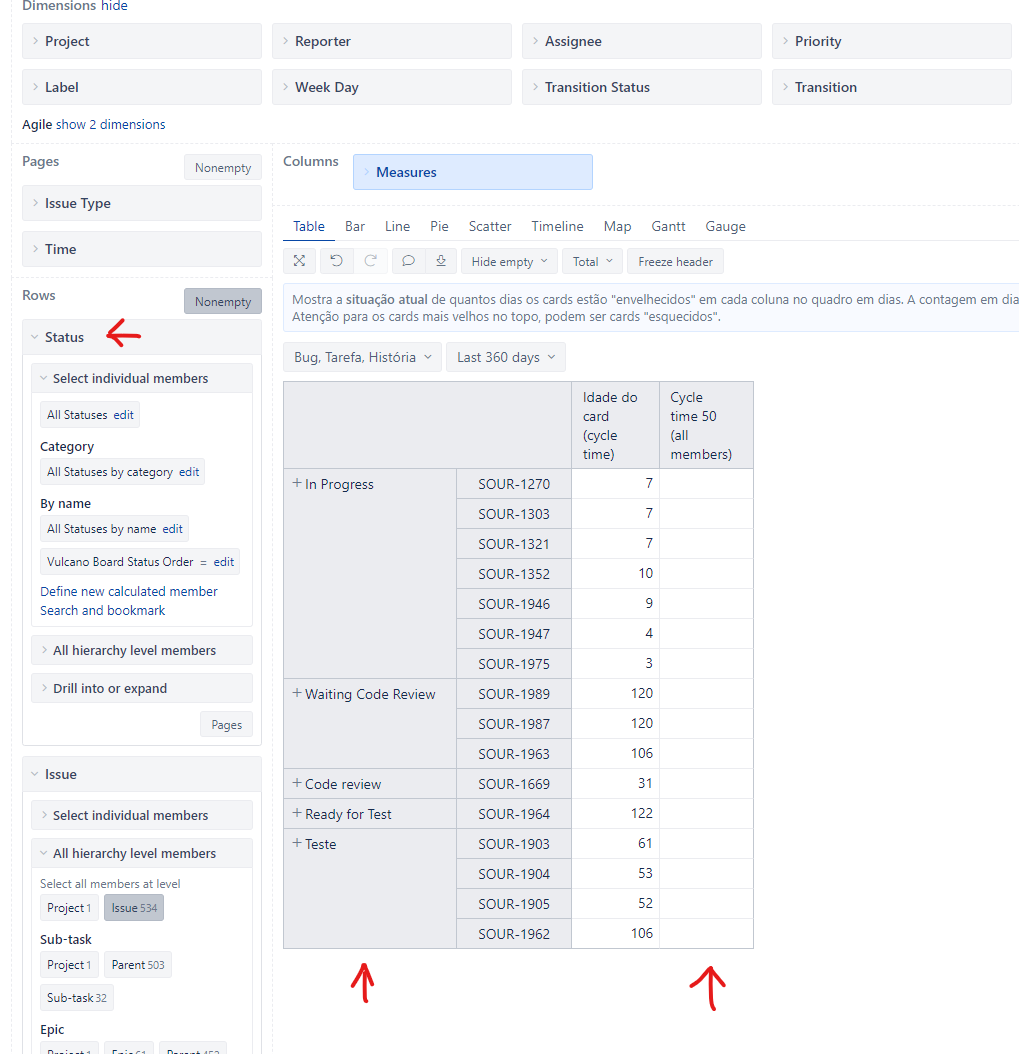
The problem with my current graph is that the rows are the opposite and the calculated measure is not the ones visible on the table. To change that I tried to used .Members of the issue dimension, it works until I only use the Issue dimension, but when I add the Status dimension as a parent (required for the grouping) I don’t get the results anymore. Is there a way to show this percentile calculated for all issues outside that are not shown in the table?
Calculated measure used in this graph:
Percentile(
  Filter(
    [Issue].Members,
    [Measures].[Tempo de entrega (cycle time)] > 0
    AND
    NOT IsEmpty([Measures].[Issue resolution date])
  ),
  [Measures].[Tempo de entrega (cycle time)],
  50
)
Adding the status dimension as a top hierarchy does not work anymore:
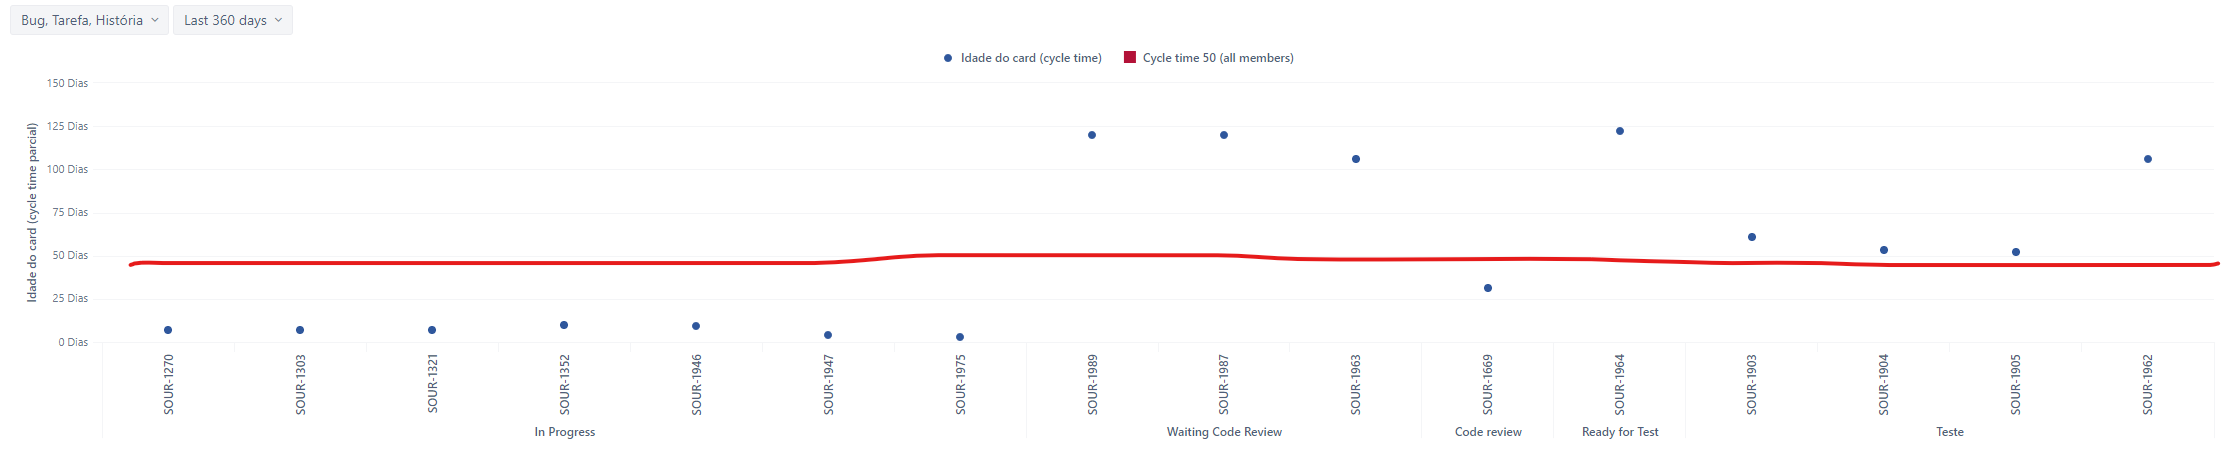
Result I’m trying to achieve:
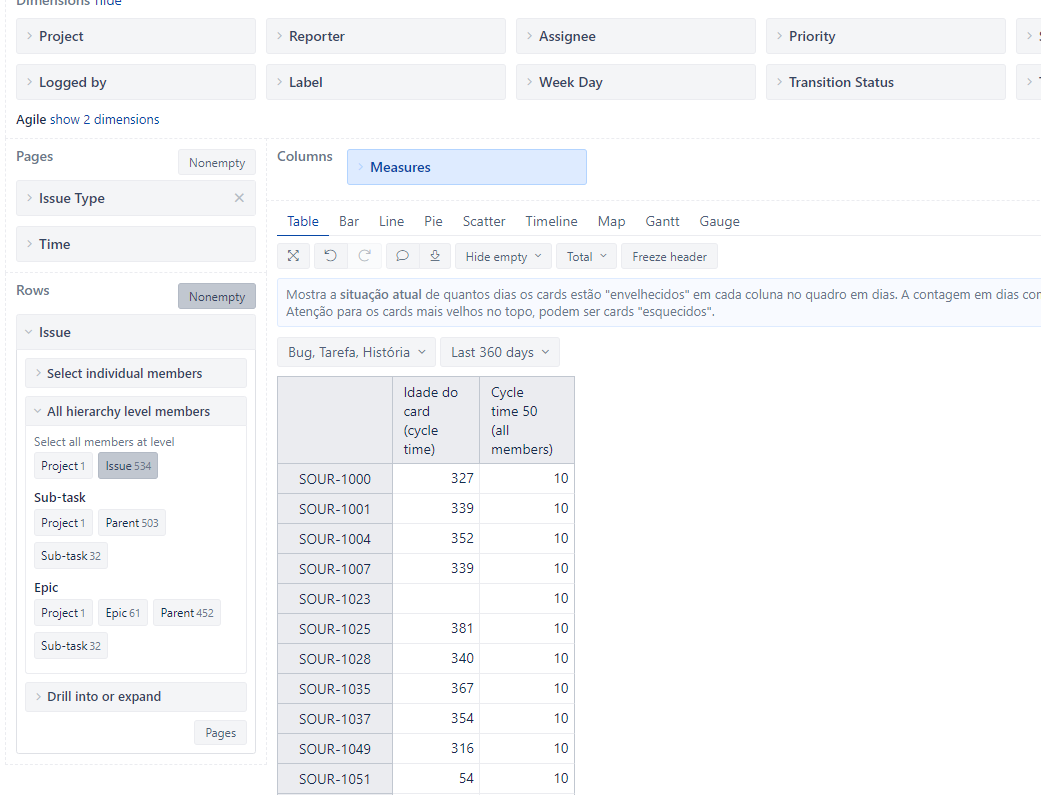
Works with only using the issue dimension:
Hi @Thomas_Kuryura ,
I suspect the problem could be tied to the measure involved in both calculations - “Tempo de entrega (cycle time)”. Is it a calculated measure? Please share its formula.
Also, you seem to consider resolved issues in the second calculated measure. But the Status dimension calculated members seem to consider unresolved issues, judging by their names. So that could also be part of the problem.
Best,
Roberts // support@eazybi.com
Hi @roberts.cacus Indeed the calculated measure “Tempo de entrega (cycle time)” only consider resolved issues, here is the formula:
Cache(NonZero(Avg(Filter(
  Descendants([Issue].CurrentHierarchyMember,[Issue].[Issue]),
  (
    [Measures].[Transitions to status],
    [Transition Status.Category].[Done]
  )>0),
  Datediffdays(
      DateWithoutTime(([Measures].[Transition to status first date],
      [Transition Status.Category].[In Progress],
      [Time].CurrentHierarchy.DefaultMember)),
      DateWithoutTime(([Measures].[Transition to status last date],
      [Transition Status.Category].[Done]))
-- +1 is used to have inclusive dates (D+1)
    )+1
  )
)))
And my question is exactly that: even though I’m displaying non-resolved issues in the table, can I make a calculation of the percentile on all other issues that are resolved and not displayed and show those in a column called “cycle time 50”?
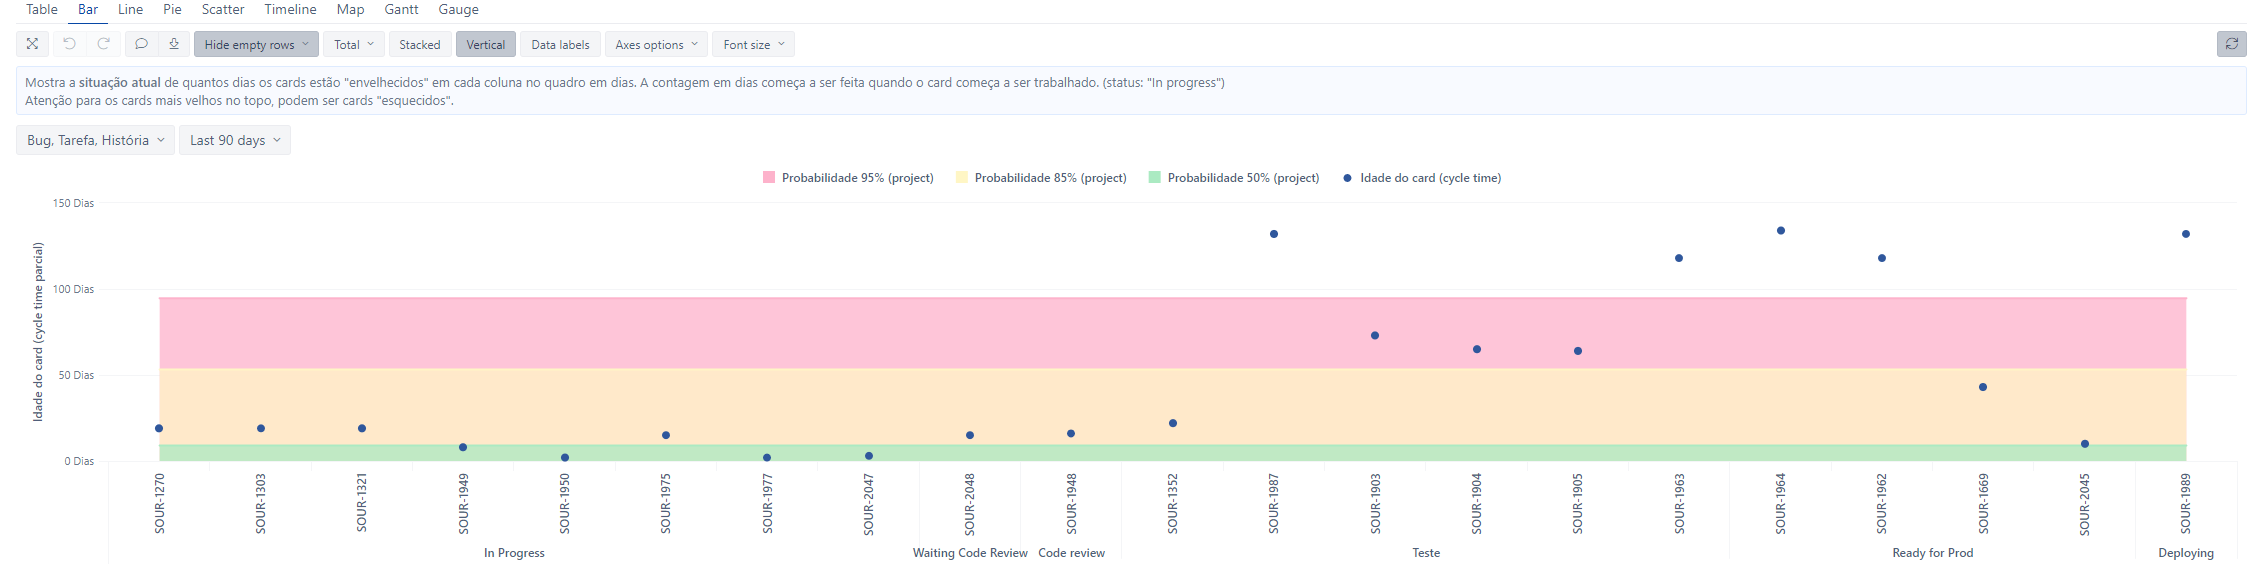
Found an easier solution using tuples and DefaultContext:
DefaultContext(
  (
    [Project].[Vulcano],
    [Issue Type].CurrentMember,
    [Time].CurrentMember,
    [Measures].[Probabilidade 50% (1 item)]
  )
)
Since this value is already calculated in the top hierarchy you just have to bring this value down with a tuple, using CurrentMember to respect the current pages and DefaultContext to asume everything else is in the top hierarchy.
This is the result:
1 Like
Are you able to send me a copy of your report definition? I am interested in the banded percentiles that you are leveraging in your report as well. This would be extremely helpful.