Hello!
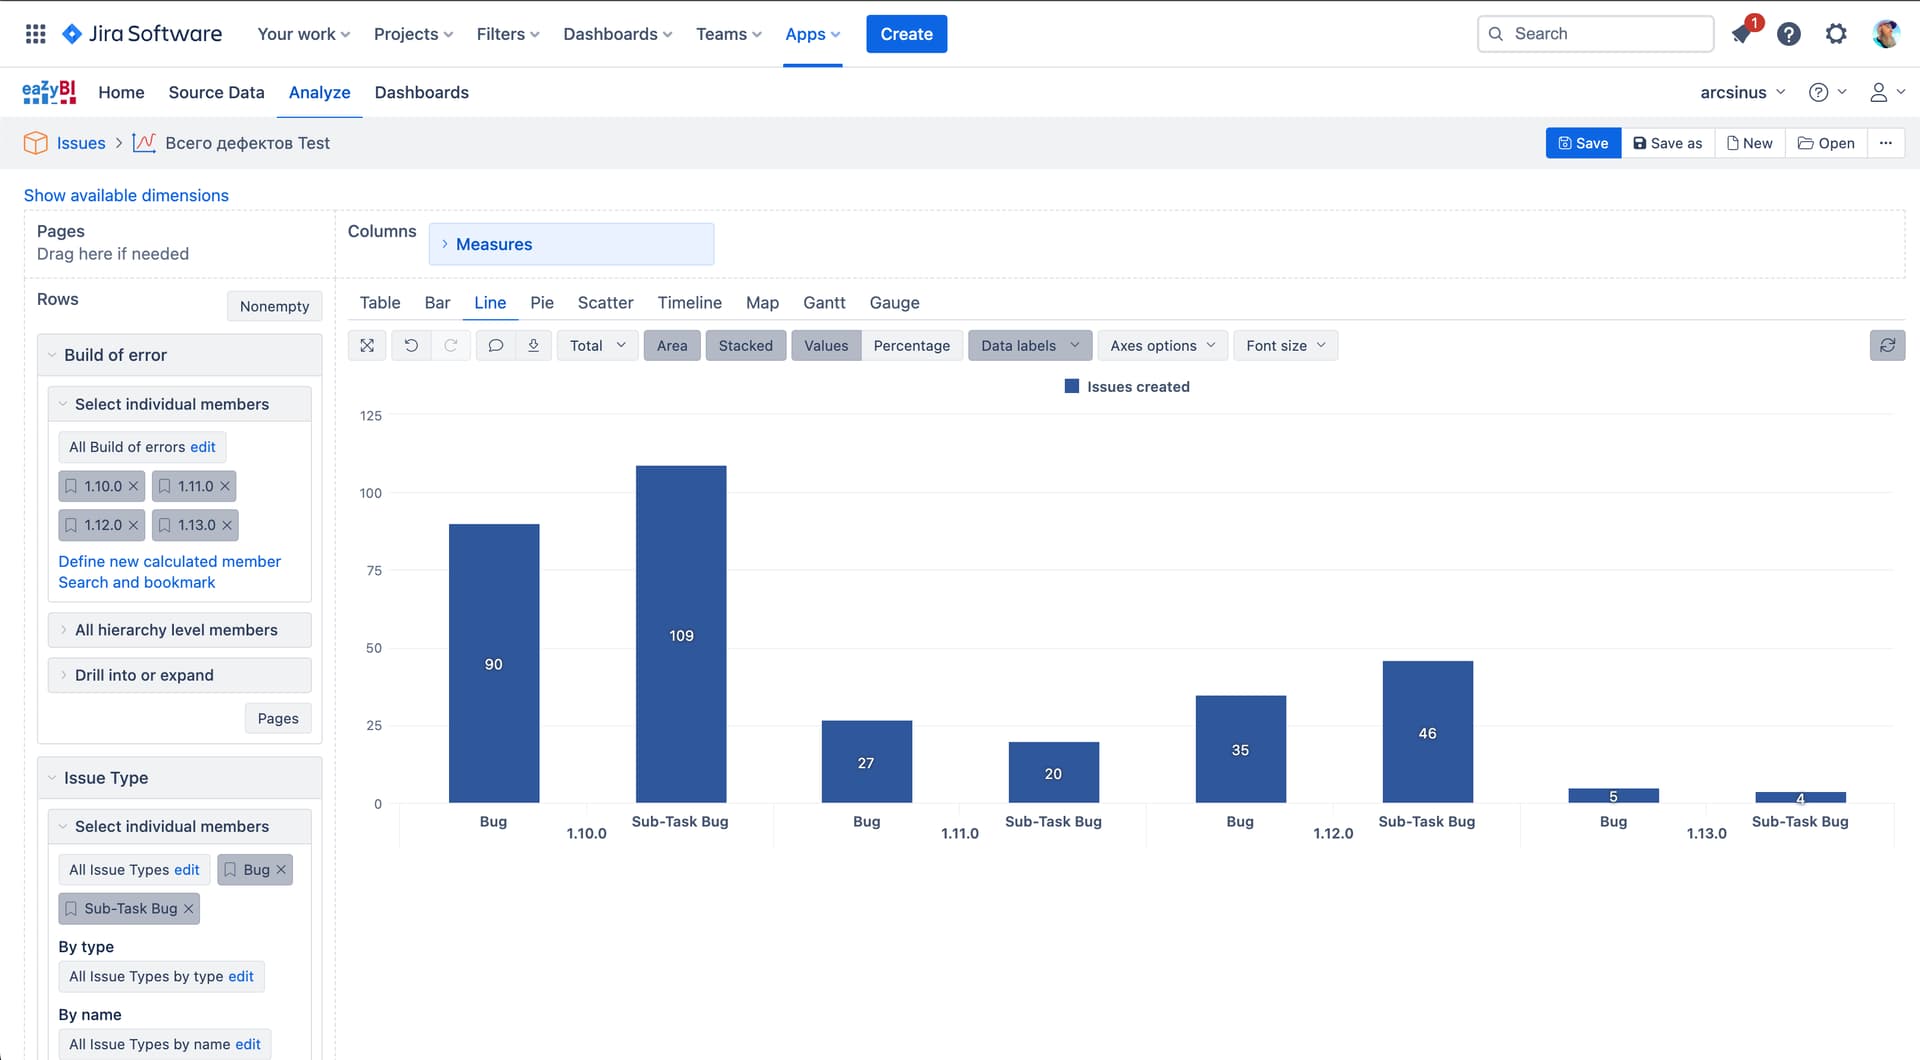
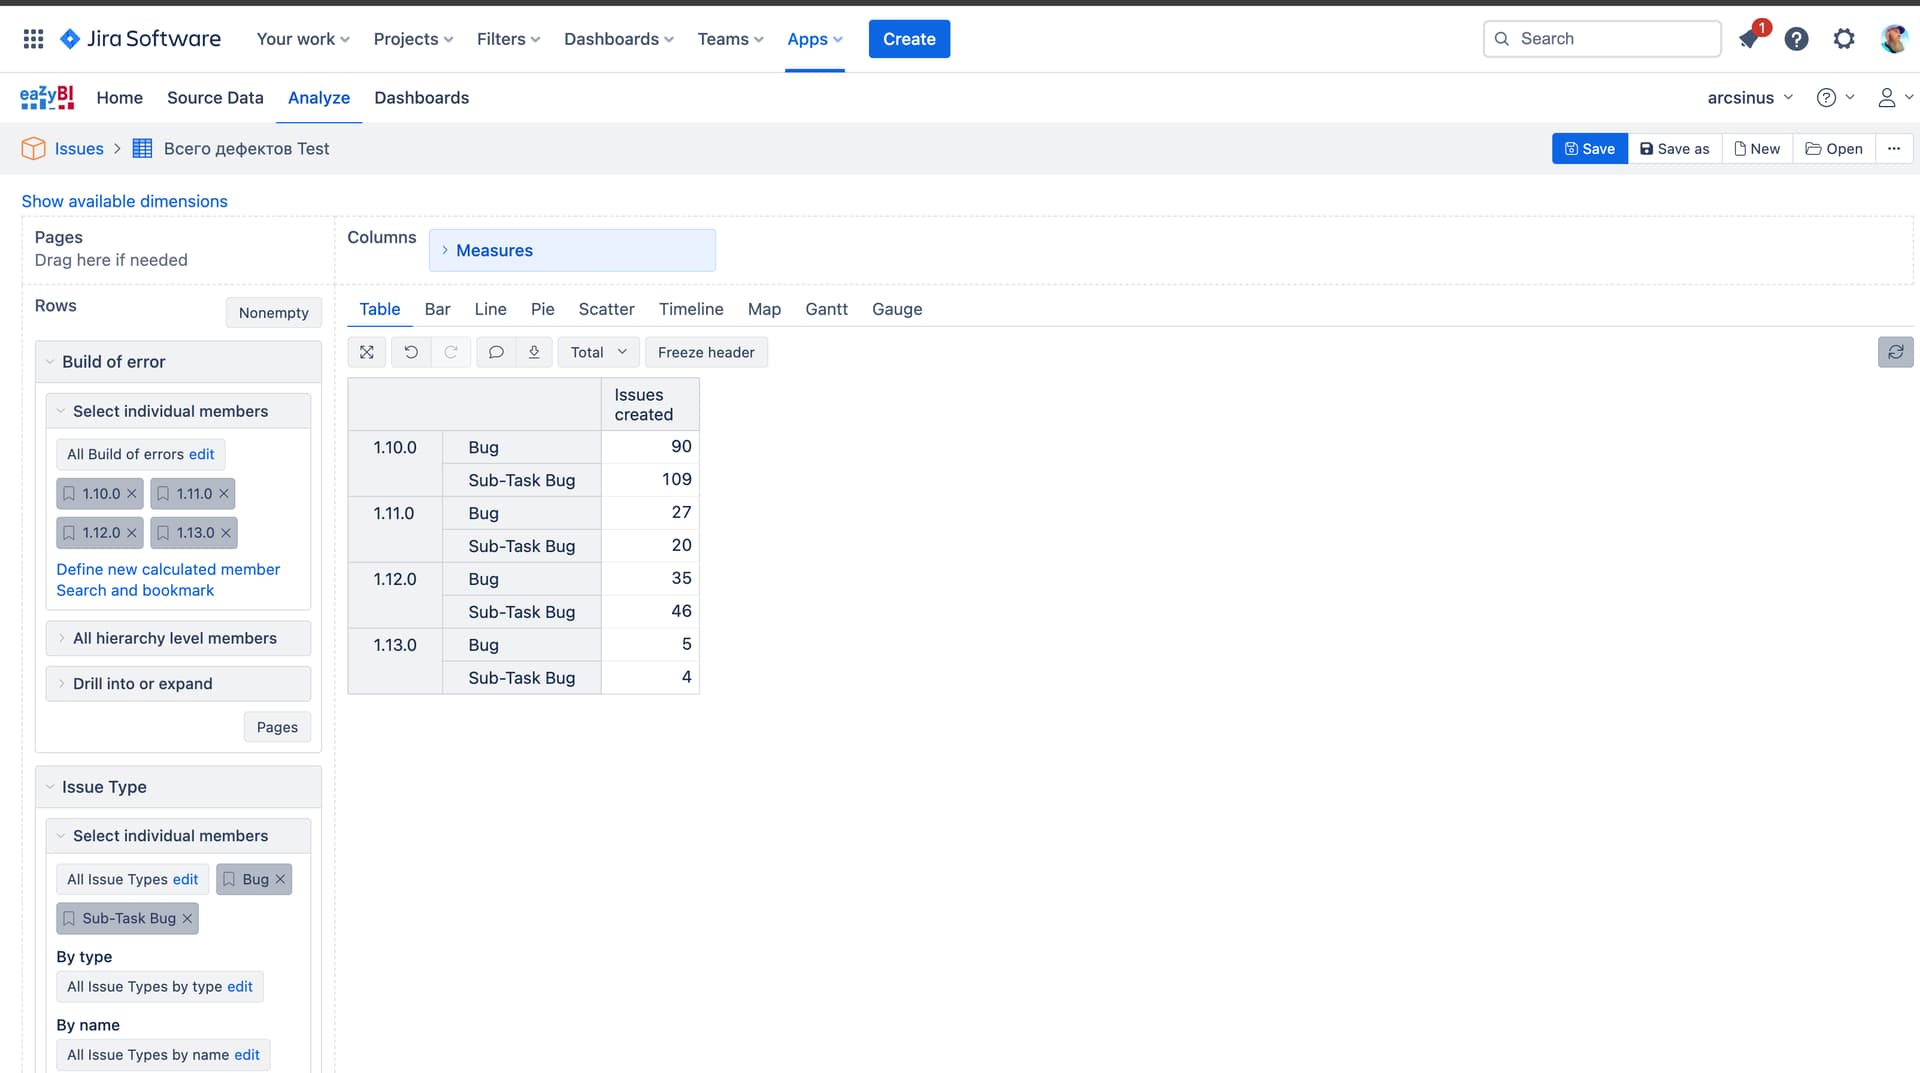
There is a task to create an accumulation histogram to display data on releases.
According to the documentation, it’s not entirely clear how to do it, although there are screenshots of it. Please help me with advice on how to build it correctly.
It is necessary to display the bug and sub-task bug data in different colors in one column.
The question is closed. Thanks for the help.
1 Like
Hi @Russkih,
I am happy you solved the problem on your own. But for the sake of community, to help others who may have a similar question, I encourage you to share how you solved the problem.
For example, to display the Bug and Sub-task Bug issue types in a single column with different colors, I would have moved the Issue Type dimension into columns. Then, the “Stacked” option would work as expected.
Best,
Roberts // support@eazybi.com