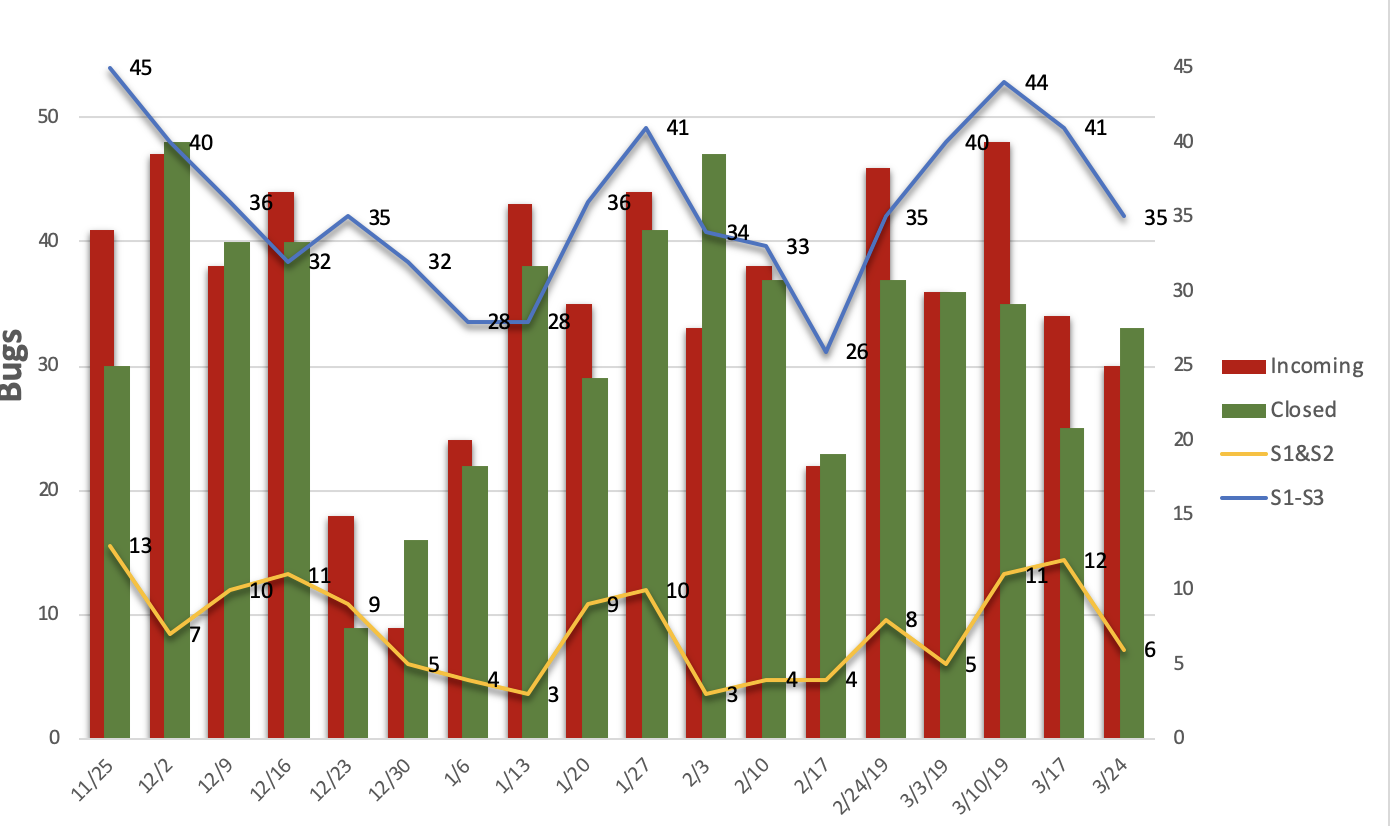
I am looking to generate a graph similar to -
I generate this manually currently. It calculates number of incoming and closed issues for a week. Along with this It also tracks total of S1+S2, S1+S2+S3 and all open issues. Can this be created in eazyBI?
Urgent need for an automated solution would be helpful here
Can eazyBI support look at this and confirm if this is possible with eazyBI?
Hi @chiruta,
For this chart, you can use the default measures “Issues created” and “Issues closed” for the incoming and closed issues.
For the S1+S2 and S1-S3, I presume that those are severities. For the calculation of the open issues with those severities, first, it is necessary to create two calculated members in the Severity dimension. They will aggregate those severities. The formulas for Severity dimension calculated members “S1+S2”:
Aggregate({
  [Severity].[S1],
  [Severity.[S2]
})
and “S1-S3”:
Aggregate({
  [Severity].[S1],
  [Severity.[S2],
  [Severity].[S3]
})
Now you can create two calculated measures that form a tuple out of the measure “Open issues” and one of the calculated members from the Severity dimension. For example, the “S1+S2”:
([Measures].[Open issues],
[Severity].[S1+S2])
In the sample report below, I used the Priority dimension calculated members:
Kind regards,
Roberts // eazyBI support
Thanks @roberts.cacus, this worked