Hi All, I wanted to have a column having cumulative values of the below table
[Image 1]
can you please help me on how to do that?
Do we need to Define new calculated measure?
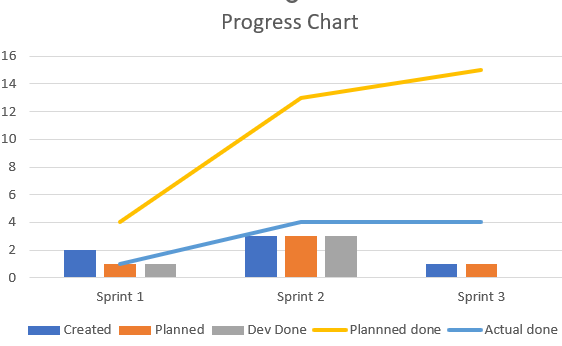
At the end I want to have a chart like this

Hi All, I wanted to have a column having cumulative values of the below table
[Image 1]
can you please help me on how to do that?
Do we need to Define new calculated measure?
At the end I want to have a chart like this

Hi @Mary,
Suppose you want to see all the statuses in the columns. In that case, you can do without calculations. The first step would be selecting the Sprint dimension in the report rows. Then choose the measures “Issues created” and “Issues closed”. By clicking on the “Issues created” and “Issues closed” measure headers, you can create a standard calculation for the cumulative sum. After that, you can remove the measure “Issues closed”.
Once you have done that, you can drill measure “Issues created” into the Status dimension. And the report could look similar to the one below:
After that, you can switch to the bar chart view and update the chart types for the cumulative measures. The final report could look similar to the one below:
Best,
Roberts // support@eazybi.com
Thanks Robert this is what I was looking for