Hi,
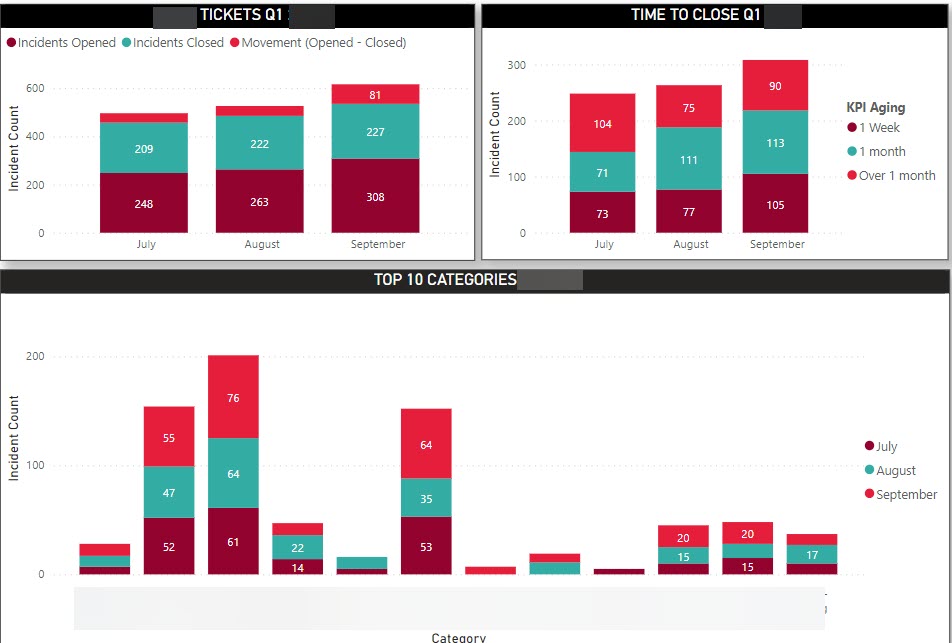
I am new to eazyBI and I want to create a filter that I would be able to use to create a report similar to the attached. I can get away with creating a measure of the count of incidents, incidents closed and the difference between the two.
My challenge is getting the qtrs accurately and naming them per the picture.
Thanks in anticipation.
Hi @JMR
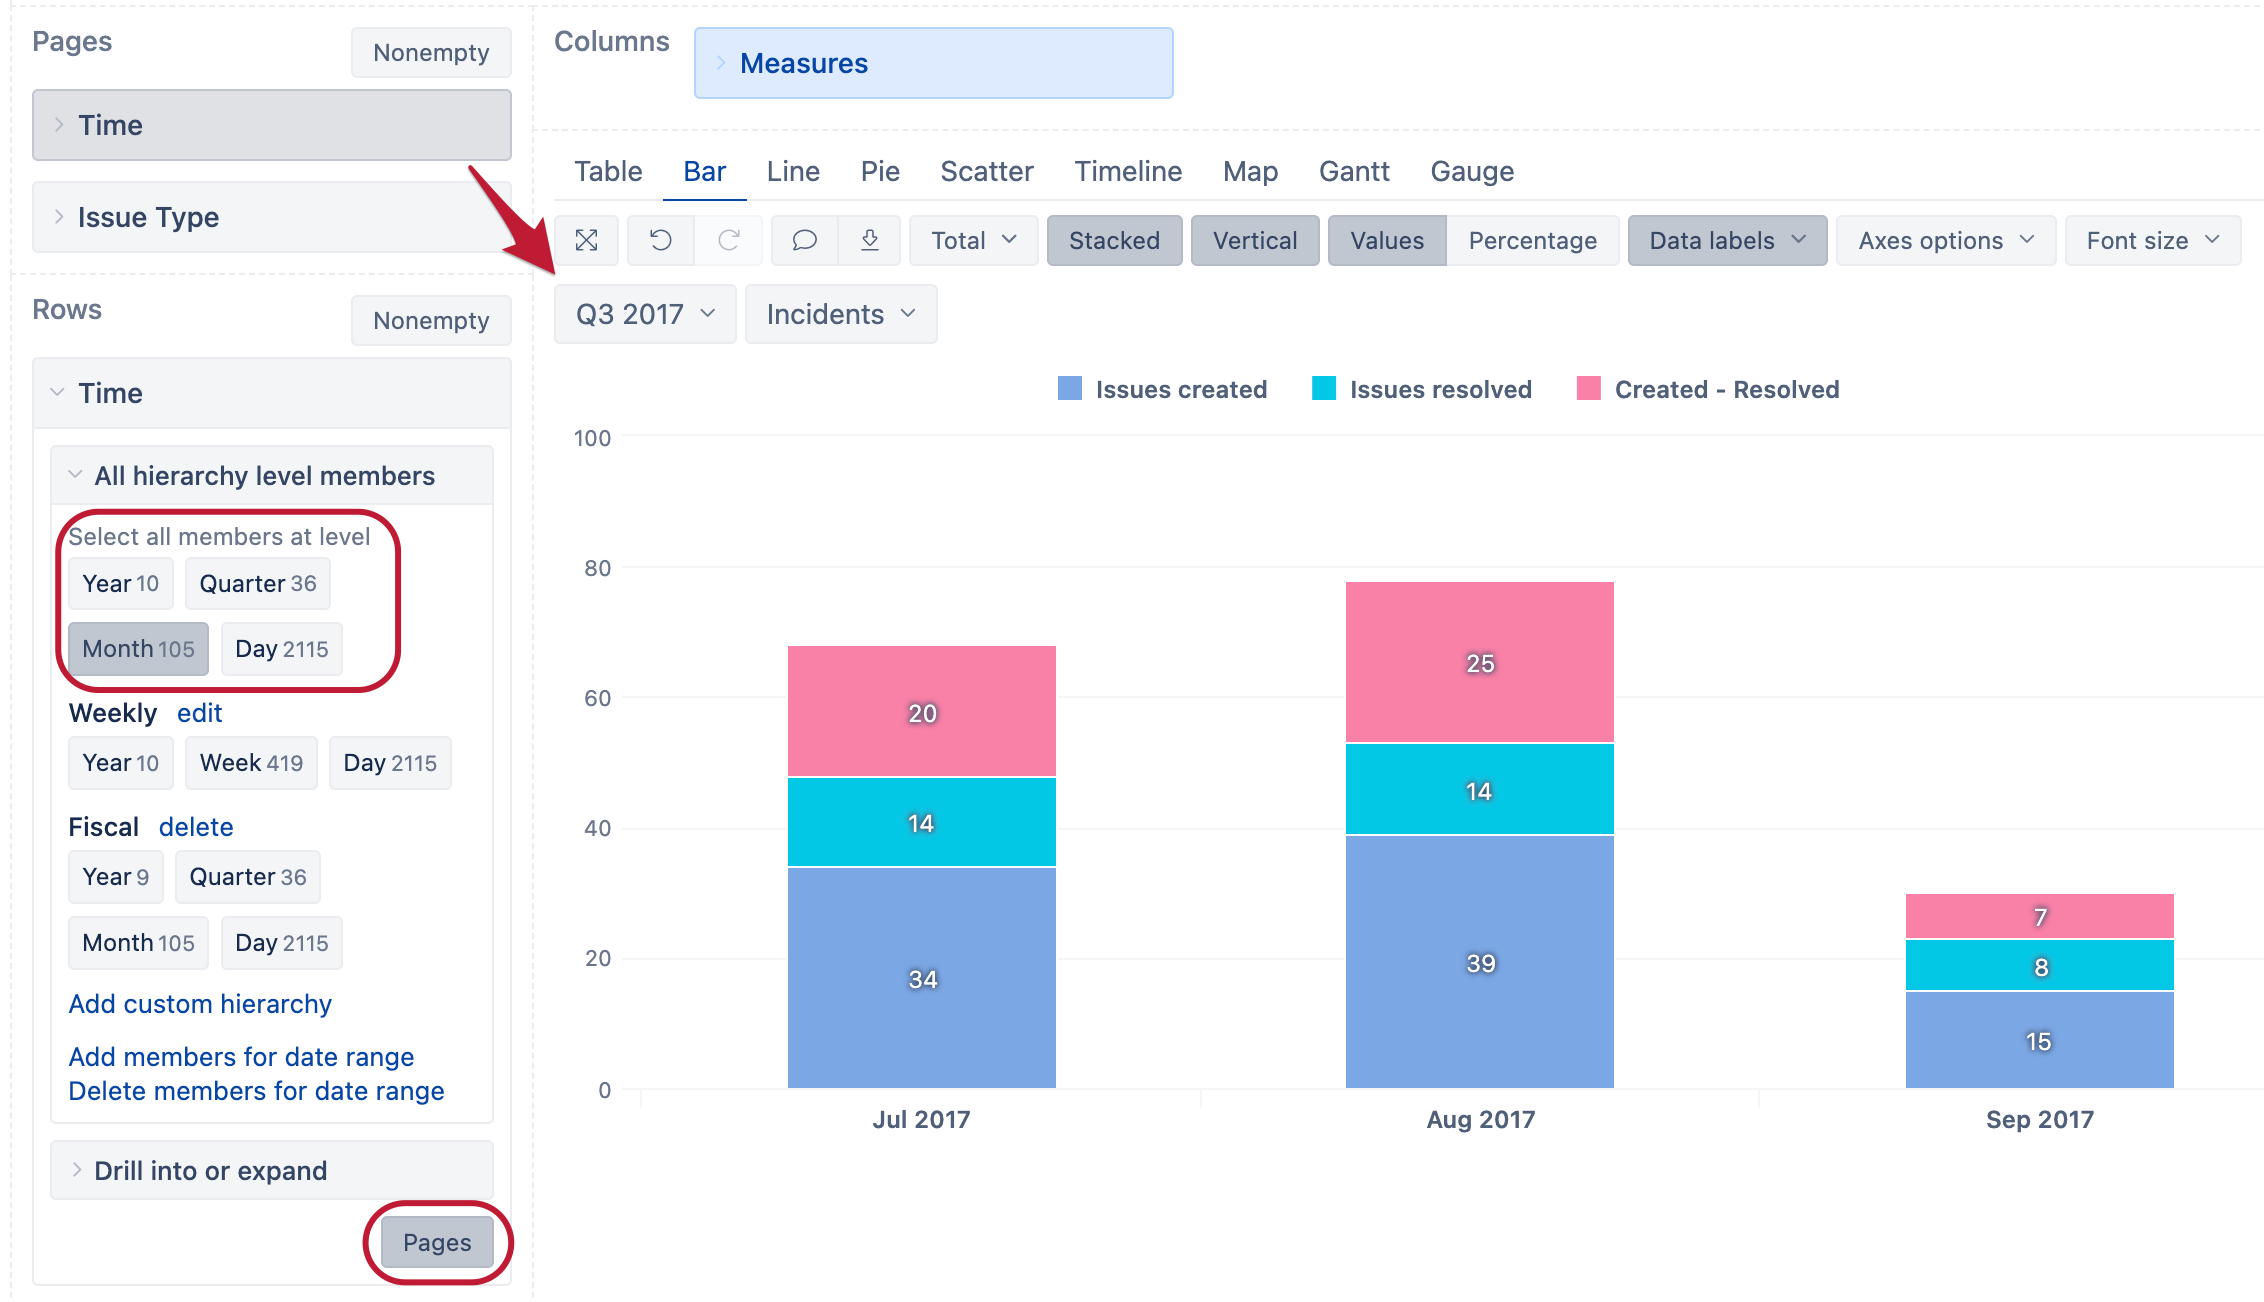
You can use the Time dimension in Rows and select the “Month” level to be displayed in the report and then click the “Pages” button, so that you can use this dimension also as a filter.
In pages filter you can now select the necessary quarter, to which you wish to see the months in the report.
The report setup should look something like this:
Let me know if this fits your use case or if you have any additional questions on this!
Best regards,
Nauris / eazyBI support
This was super helpful, I was able to create the qtrly charts per instructions.
Thanks