Hi,
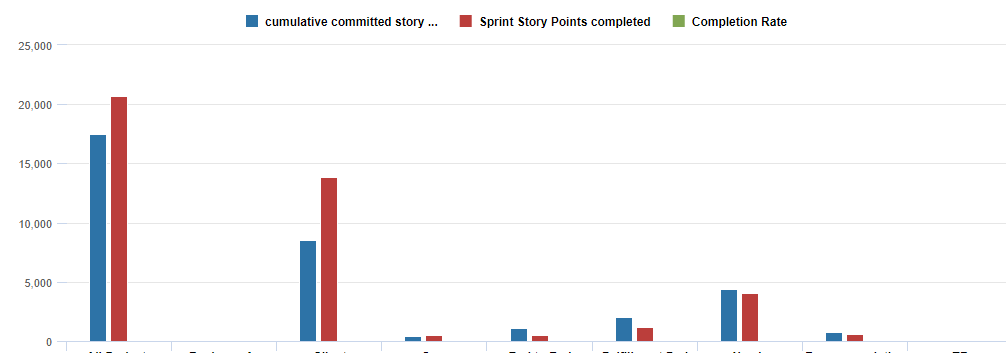
Currently I am trying to create bar/line graph and would like to have secondary axis to have different min max value.
First Y axis will be count of issues that are committed and completed.
Seocnd Y Axis will be completion rate (%).
Thanks,
Albert
