I’m having a devil of a time figuring out this data mapping. Everything I try seems to have a small detail that works against me.
I have a table in Excel that I’m manually maintaining. I export to CSV then upload to eazyBI as a data source file.
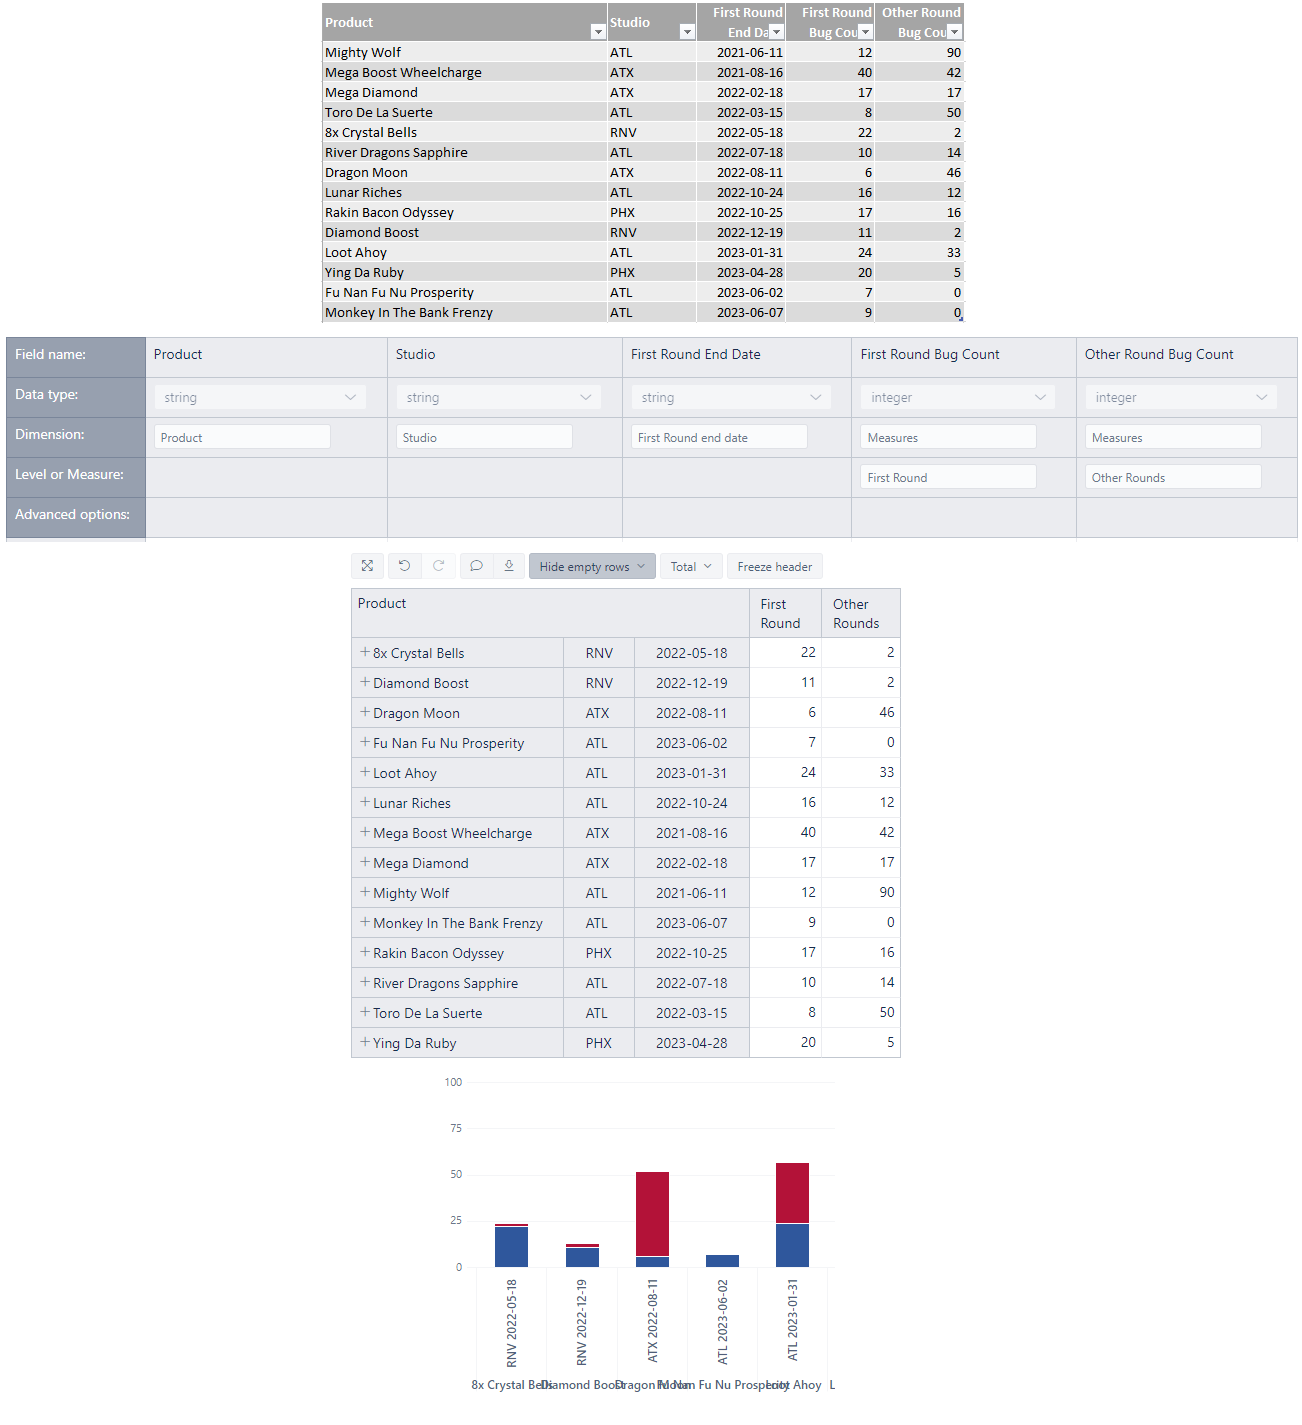
The report keeps forcing the table to sort by Product alphabetically even though the data source is pre-sorted. I’m trying to map the data so that I can sort by First Round End Date. I also need Studio as a column, though I don’t need to sort by it.
I’ve tried several different mappings, and but the closest I’ve come is the most basic one.
This works in allowing the columns to show up in the table the way I want (after adding as Rows and hiding empty rows), but I can find no mechanism for sorting by anything other than the numerical columns.
The bar chart is also a jumbled mess of labels that I can’t seem to control.
So what am I failing to grasp here? Do I need to map this data a super specific way?