Hi all,
I’m looking for a way to add custom calculations to my table in EasyBI.
Right now I have a Quality Score of several components and a total score. I would like to add another table that will show the percentage of each component compared to the total score. Is there a way to do that?
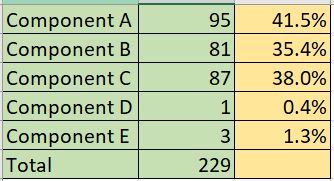
Here is an example of what I’m looking for. Cells colored green is what I already have and cells colored in yellow are what I’m looking to add.
There are two options on how to calculate the %.
eazyBI has a default calculation % of total you can consider using. Click on the header of the measure in the table chart and select the option Add calculated > % of total. This measure will add the % from sum of the rows.
However, if some issues have several components it might not reflect the % of issues with the component. If this is the case, you can use MDX calculation to calculate % of issues with a component for a project
Here is an example formula for % of component per project
CASE WHEN
([Measures].[Issues created],
 [Project].CurrentMember.Parent) > 0
THEN
[Measures].[Issues created] /
([Measures].[Issues created],
 [Project].CurrentMember.Parent)
 END
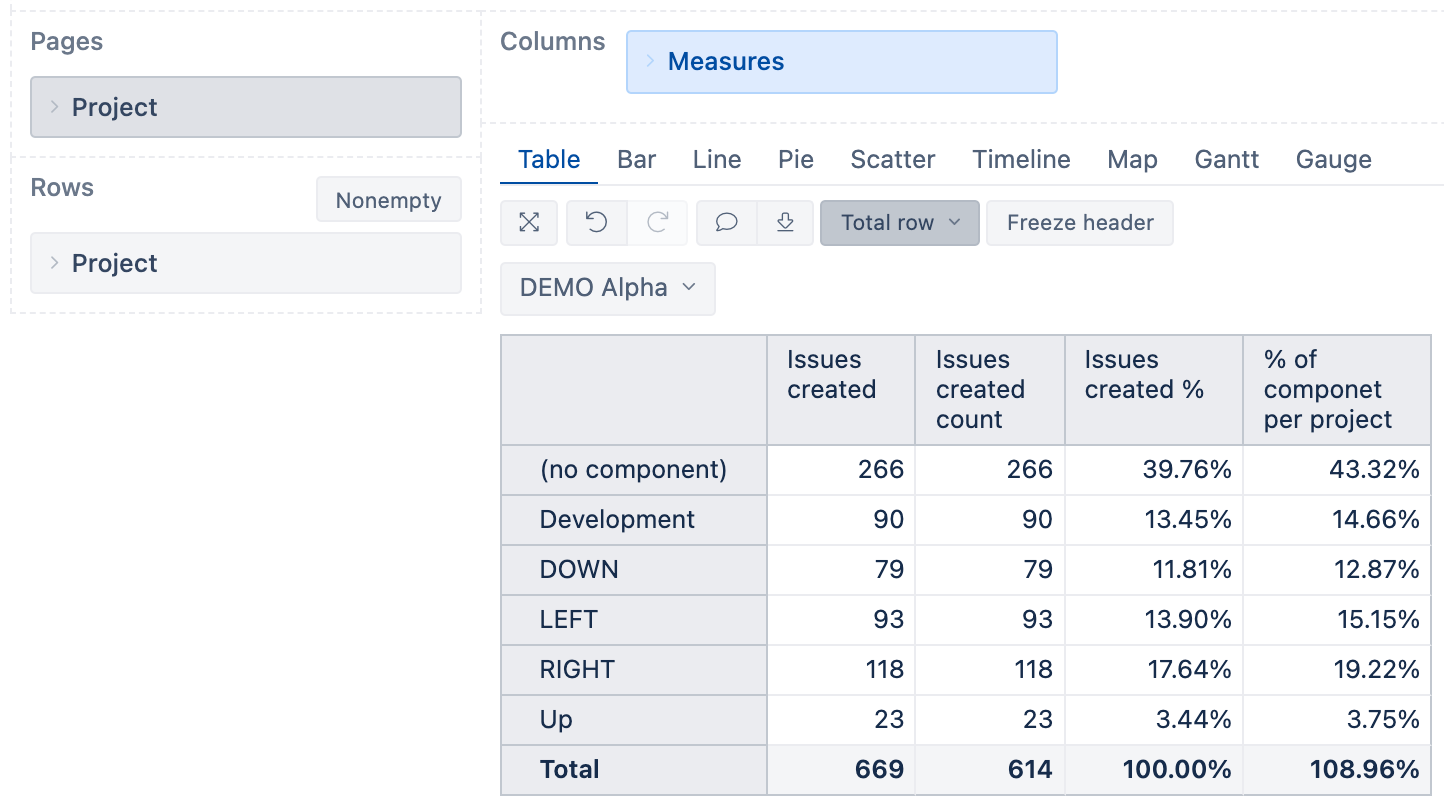
Here is how it looks in the report:
Daina / support@eazybi.com
This is exactly what I was looking for. Thank you very much @daina.tupule!