Hello
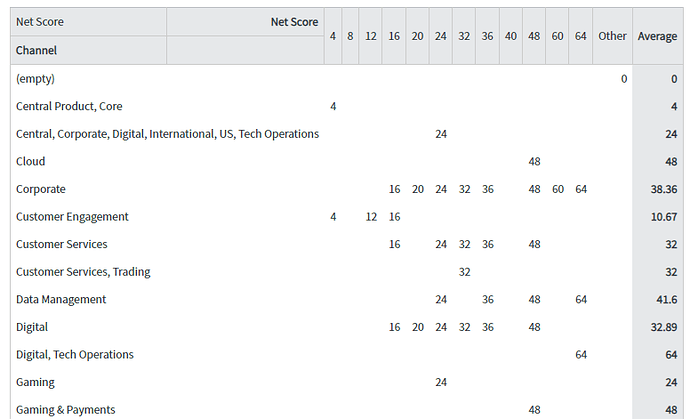
I have the below measure in EazyBI to calculate Net Score:
4*([Measures].[Net Impact]*[Measures].[Net Likelihood])
And I’d like to built the below report showing count of net score in intervals along with an average.
Please could someone assist?
FYI not sure if it matters but Net Impact and Net Likelihood are originally text fields - I’ve had to convert them into numbers before multiplying them to calculate the net score.
Thanks in advance
Joe
Hi @joejames,
Are those data from Jira or some other data source?
In the case of Jira data import, you might want to transform “Net Impact” and “Net Likelihood” from text to numbers already during data import and import them as measures. Thre are several benefits to this approach:
- eazyBI can generate an interval dimension for any measure. Here is instruction on how to do this: Advanced settings for custom fields
- eazyBI will generate a set of measures representing aggregated values and count of issues with each value. For example, “Net impact created”, “Net impact resolved”, “Issues with net impact created”,“Issues with net impact resolved” (Jira custom fields).
- For average calculation, you may use the generated set of measures and divide the total value by the issue count with the selected value.
Here are two more community posts on transforming text field to numeric field with JavaScript:
If this is not working for you, please share more details on how you have built the report so far (report definitions woudl be a valuable addition), what “Net Score” represents in business language, and at which level (issue, project, some category) would you like to calculate the average of Net Score.
Best,
Zane / support@eazyBI.com
