How does one create a ‘totals’ column that can be filtered when there’s multiple columns to drill into? This is also useful to display a label on the chart and be able to hide the symbol, and also where the number of rows are very high and you only want the top x number or values >100 for example. The standard total column for some reason doesn’t let you hide the symbol and can’t be filtered.
The solution recommended here is to create a new custom measure that adds up all the relevant data. To use this, you must use the ‘drill into’ function on the other data that you’re splitting, because if you instead add a column, it also expands out your new totals measure (which defeats the purpose of the totals column that can be manipulated and displayed as a single value).
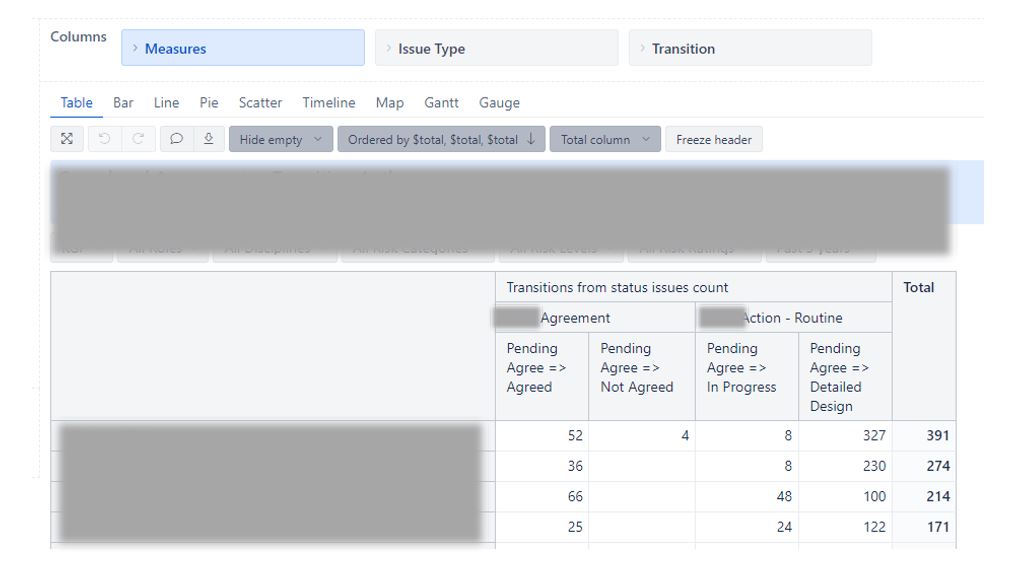
This works until there’s multiple columns like the attached photo, because the ‘drill into’ feature only seems to work down to one level.
I’ve created the following custom measure which gives me the correct number, but if I add the Issue Type and Transition columns, it expands out my totals measure, and I can’t use ‘drill into’ beyond the ‘issue type’ dimension.
([Measures].[Transitions from status issues count],
[Issue Type].[MoC Agreement],
[Transition].[Pending Agree => Agreed])
+
([Measures].[Transitions from status issues count],
[Issue Type].[MoC Agreement],
[Transition].[Pending Agree => Not Agreed])
+
([Measures].[Transitions from status issues count],
[Issue Type].[MoC Action - Routine],
[Transition].[Pending Agree => In Progress])
+
([Measures].[Transitions from status issues count],
[Issue Type].[MoC Action - Routine],
[Transition].[Pending Agree => Detailed Design])
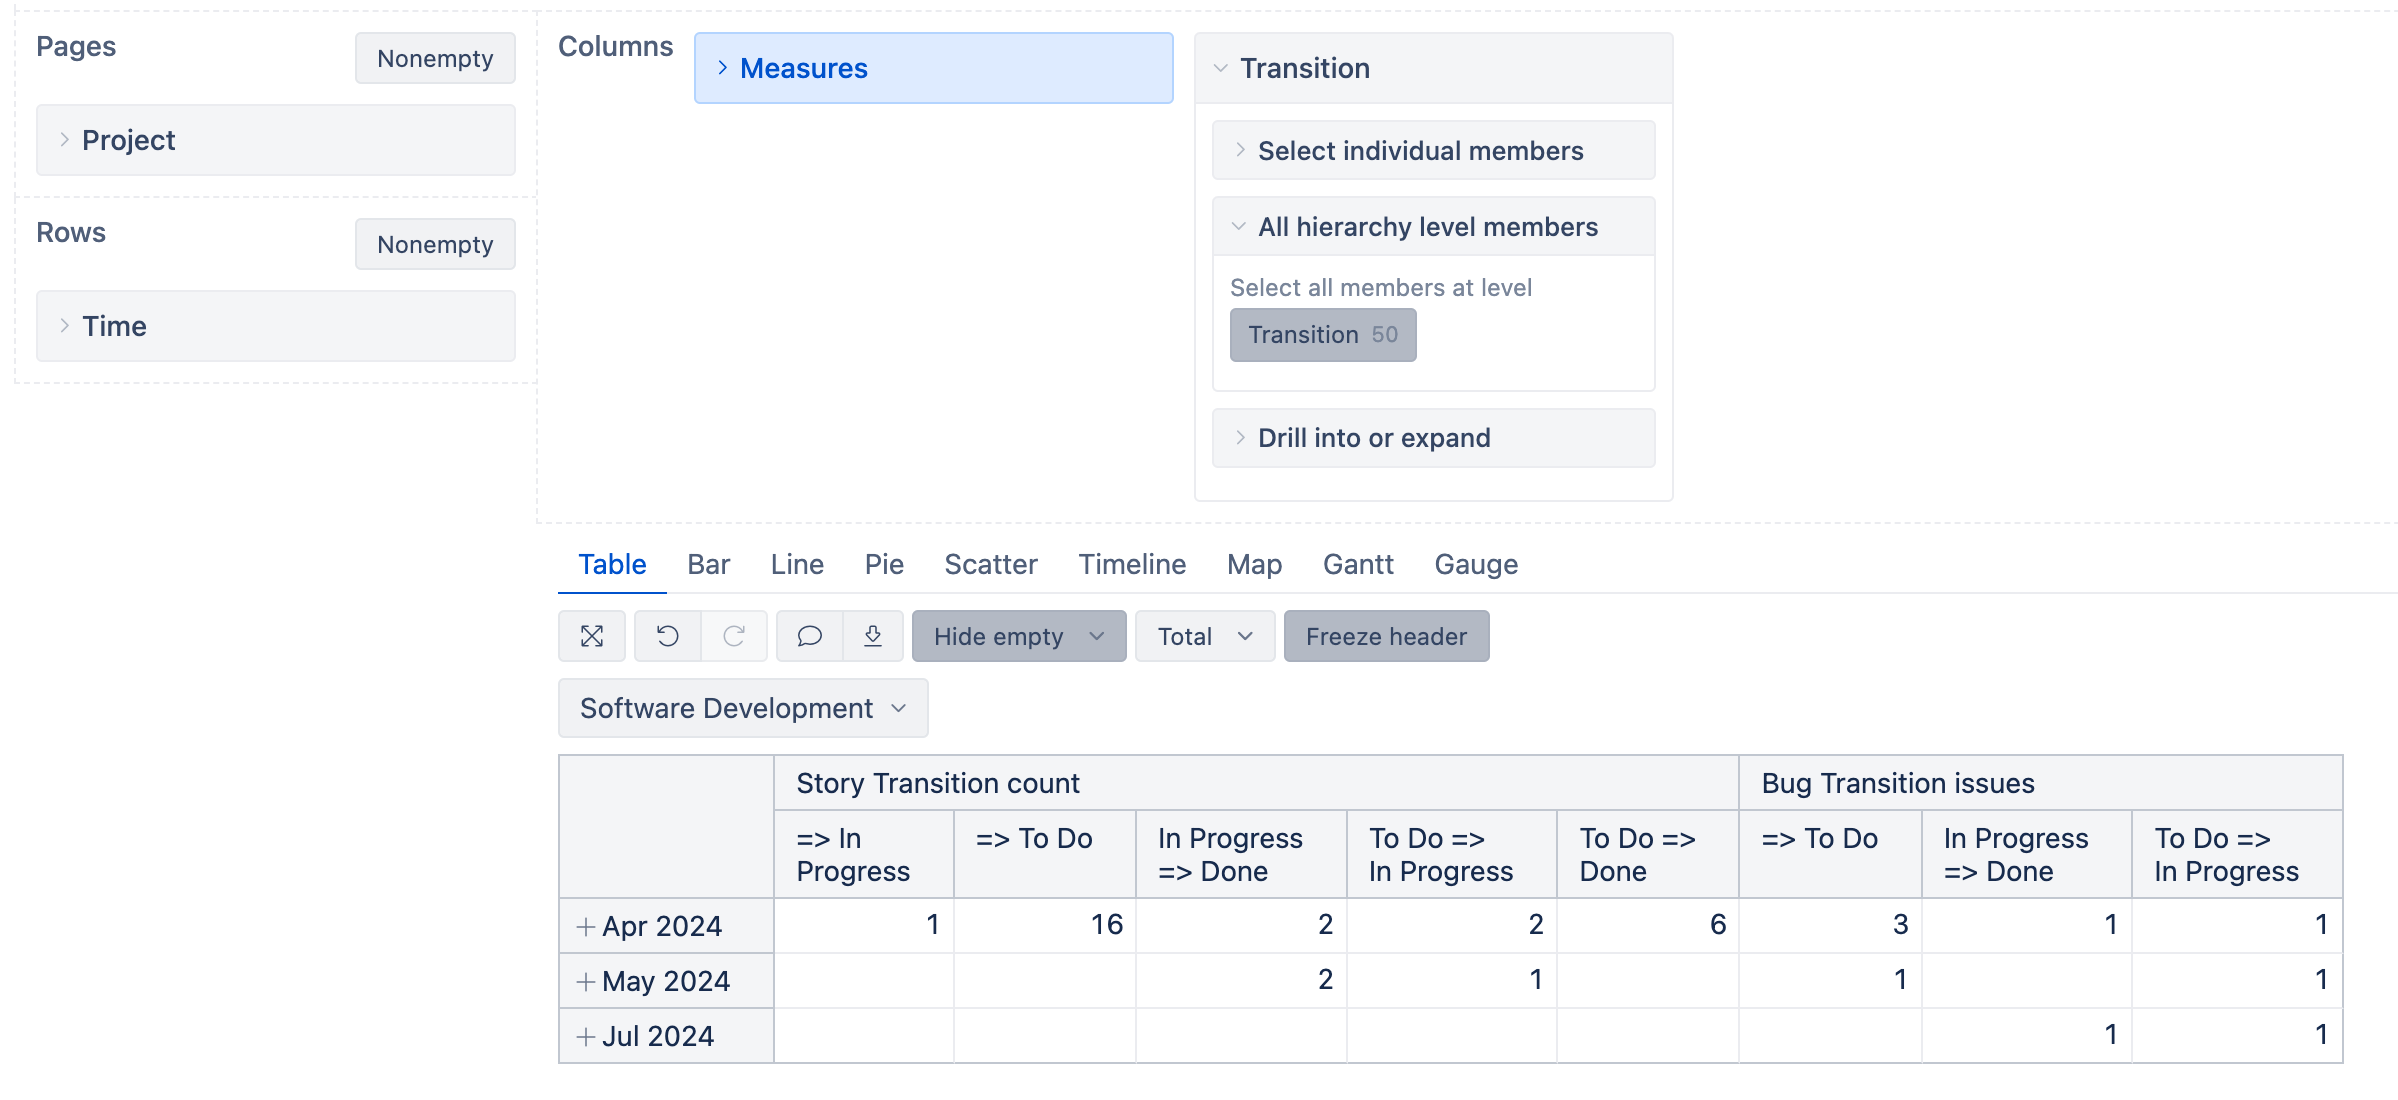
I recommend removing the Issue Type and Transition dimensions from the report. After that, create two calculated measures for each issue type - a tuple of the “Transitions from status issue count” measure and the desired issue type. Use these two measures in the report columns.
Next, use the drill into another dimension functionality to drill both calculated measures into the Transition dimension “Transition” level - Create reports. The report could look similar to the one below:
Finally, define a new calculated measure that will consider the measures used in the report columns, and determine their total for each row. Use the following formula:
CatchException(
  Sum(
    Except(
      -- set of measures used in the report columns
      Generate(
        VisibleColumnsSet(),
        [Measures].CurrentMember
      ),
      -- exclude this calculated measure itself
      [Measures].[THIS-MEASURE-NAME]  -- <== change name to this measure name
    ),
    -- sum the measure values
    [Measures].CurrentMember.Value
  )
)
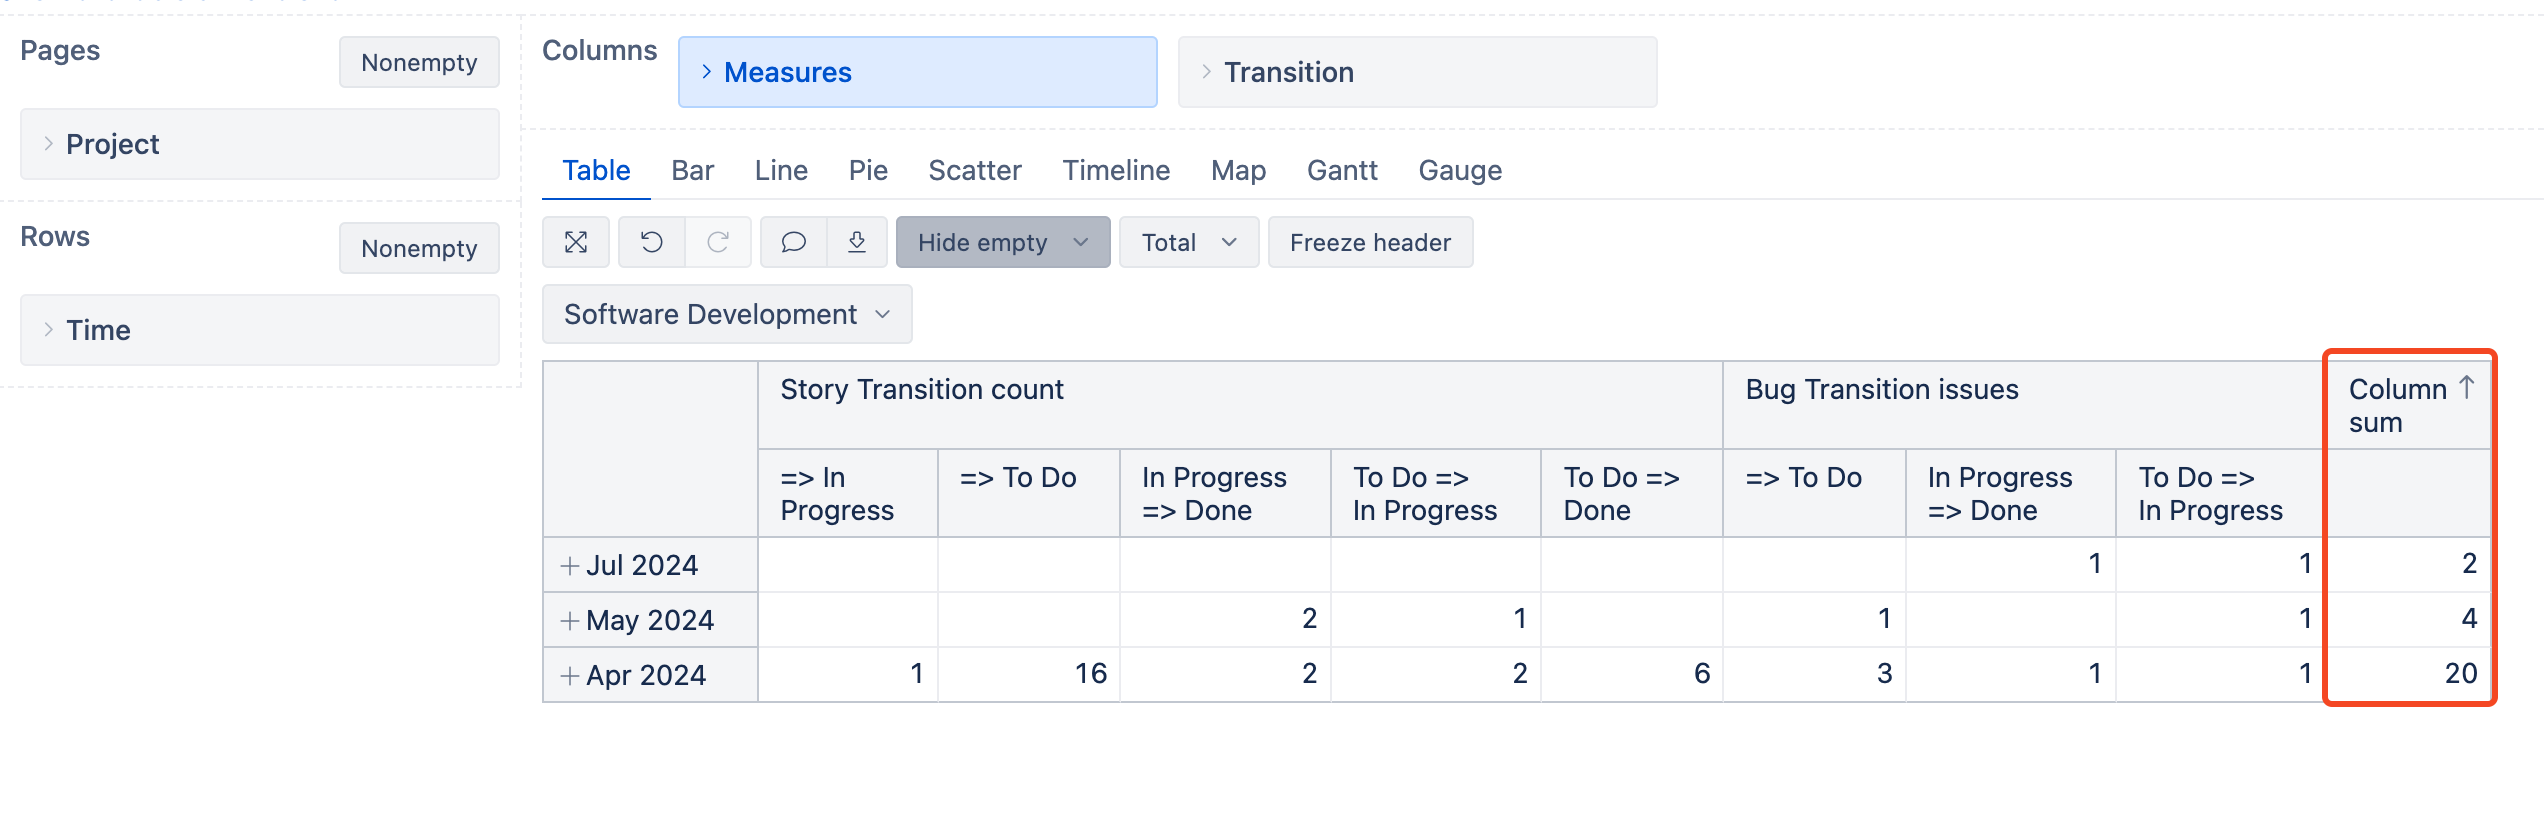
Replace THIS-MEASURE-NAME with the name you give this calculated measure so it doesn’t include itself, resulting in a loop. Upon saving the calculated measure, you will be presented with a warning. It is OK to ignore it in this case. The report could look similar to the one below:
In my case, the totaling measure is called “Column sum”, and I used it in the above formula in place of THIS-MEASURE-NAME.
You can then order the report rows by this calculated measure. Please look at our documentation page for more information on defining calculated measures - Calculated measures and members.
I may have overcomplicated it. If you don’t exclude any Transition dimension members, just adding both calculated measures with tuples should give you the desired result.