I’m extremely new to eazyBI (my employer bought it recently) and I’m trying to figure out the best way to do something seemingly simple.
I want to create a chart of issues created during regression testing periods for our releases, so the data would be bucketed by 2-week release periods. Each release has 2 sprints in it, and then the third sprint is a regression period wholly overlapping the first sprint of the next cycle. TLDR, I have a list of these regression periods. If you made a bar chart with time on the X axis, each bar would be each regression period.
I thought I could bring that in via CSV as a new cube similar to how you can pull it in as a data table in PowerBI, but eazyBI doesn’t work that way or I don’t know how to structure the data.
Would have to put the time ranges manually into a calculated measure? Or would I have to calculate the regression periods based on jira Release dates?
Hi @kevinwhite-verint,
Additional data import to Time members is not supported. But you may add custom hierarchies in the Time dimension, like bi-weekly or 3-week groups. There are more details on how to do this: https://docs.eazybi.com/eazybi/analyze-and-visualize/create-reports#Createreports-AddcustomhierarchiestoTimedimension
Best,
Zane / support@eazyBI.com
This starts to get where I want to be - I can probably remove individual members I’m not interested in from the hierarchy in an actual report. I basically want to look at issues created with a particular custom field value, for every other 2 week period aligned with our sprints. Thus I need to remove every other member.
As a related question, I want to make a separate report that is always showing how many issues were created with a certain custom field value, for “based on the current date, the most recent 2 week period matching some criteria”.
Example:
- Today is February 9th 2021
- Right this moment, the most recent period I want to see is January 13th through January 27th.
- starting tomorrow, the most recent period I want to see is February 10th through February 24th
- and so on
Would I have to / be able to construct a custom measure that could do that evaluation?
Hi @kevinwhite-verint,
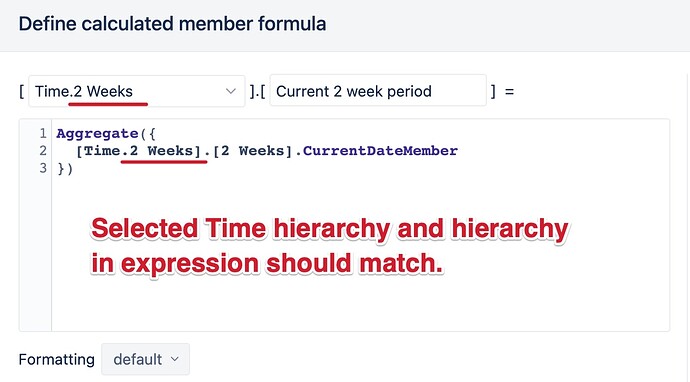
Custom time hierarchy works similarly to default and weekly hierarchy. You can create a calculated member in the Time dimension that would show two week period based on the current date.
For example, to get the current two week period expression would look like this:
Aggregate({
  [Time.2 Weeks].[2 Weeks].CurrentDateMember
})
You can check for more relative date examples in the Demo account, Time dimension. You can use formulas as a base for the 2-week hierarchy in your account. When applying those expressions make sure to select the right hierarchy and update the expression to match the selected hierarchy (see picture below).
Best,
Zane / support@eazyBI.com
