Hello eazyBI community,
I’m reaching out for assistance with creating a custom report in eazyBI that displays a list of stories in the rows and detailed duration spent in each status in the columns. The goal is to get a clear overview of the time spent in each status for each story within a specific project and date range.
Project and Status Context:
Our project has the following statuses:
- Backlog
- PO Review
- Ready for Development
- In UAT
- Ready for Production
- Market Live
Requirements:
- Filter issues by type: Story
- Filter issues by project: [XYZ]
- Filter issues by date range: [Insert start and end dates, e.g., “January 1, 2022 - December 31, 2022”]
- Display a list of stories in the rows
- Calculate the duration spent in each status for each story and display it in the columns
- Display the duration in a human-readable format (e.g., “X days”, “Y weeks”, etc.)
Example Output:
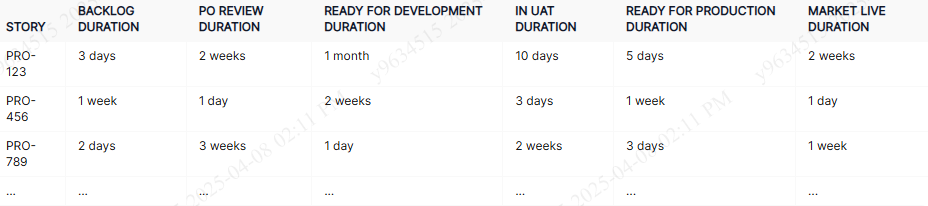
Question:
Can anyone provide guidance on how to create a custom report in eazyBI that meets these requirements? I’d appreciate any help with the necessary eazyBI syntax, formulas, or configuration settings to achieve this.
JIRA version : Jira v9.12.11 Data Center
eazyBI for Jira (version 7.2.1:node1)
Thank you