Hi @PetraK,
One approach to tackling this would be to define a new JavaScript calculated custom field that calculates the number of days it takes for the issues to complete the cycle. I would suggest defining it as an interval dimension. See the parameters for the eazyBI advanced settings below:
[jira.customfield_resolvedDays]
name = "Cycle days"
data_type = "decimal"
dimension = true
javascript_code = '''
  duration = null;
  notset = true;
  startdate = issue.fields.created;
  inprogress = ["In Progress","In Review","Ready for QA"];

  if(issue.fields.resolutiondate) {
      resolutiondate = issue.fields.resolutiondate;
      issue.changelog.histories.forEach(function(history){
          history.items.forEach(function(historyItem){
              if (historyItem.field == "status" && notset) {
                  to = historyItem.toString;
                  if (inprogress.indexOf(to) > -1 ) {
                      startdate = history.created;
                      notset = false;
                      duration += (Date.parse(resolutiondate) - Date.parse(startdate)) / 1000 / 60 / 60 / 24;
                  }
              }
          });
      });
      issue.fields.customfield_resolvedDays = duration;
  }
'''
time_unit = "days"
time_interval = "duration"
intervals = "/5"
interval_unit = "days"
The JavaScript code calculates the duration in days from the first date the issue transitioned from one of the statuses defined in the inprogress array to the issue resolution date.
The part below the JavaScript code defines the interval settings. With the settings above, the dimension members will be defined for each five days - 0-4, 5-9, 10-14, etc. You can change the intervals fitting your use case - Interval dimensions.
After updating the eazyBI advanced settings, you can import the JavaScript calculated custom field as a dimension in the eazyBI import options “Custom fields” tab.
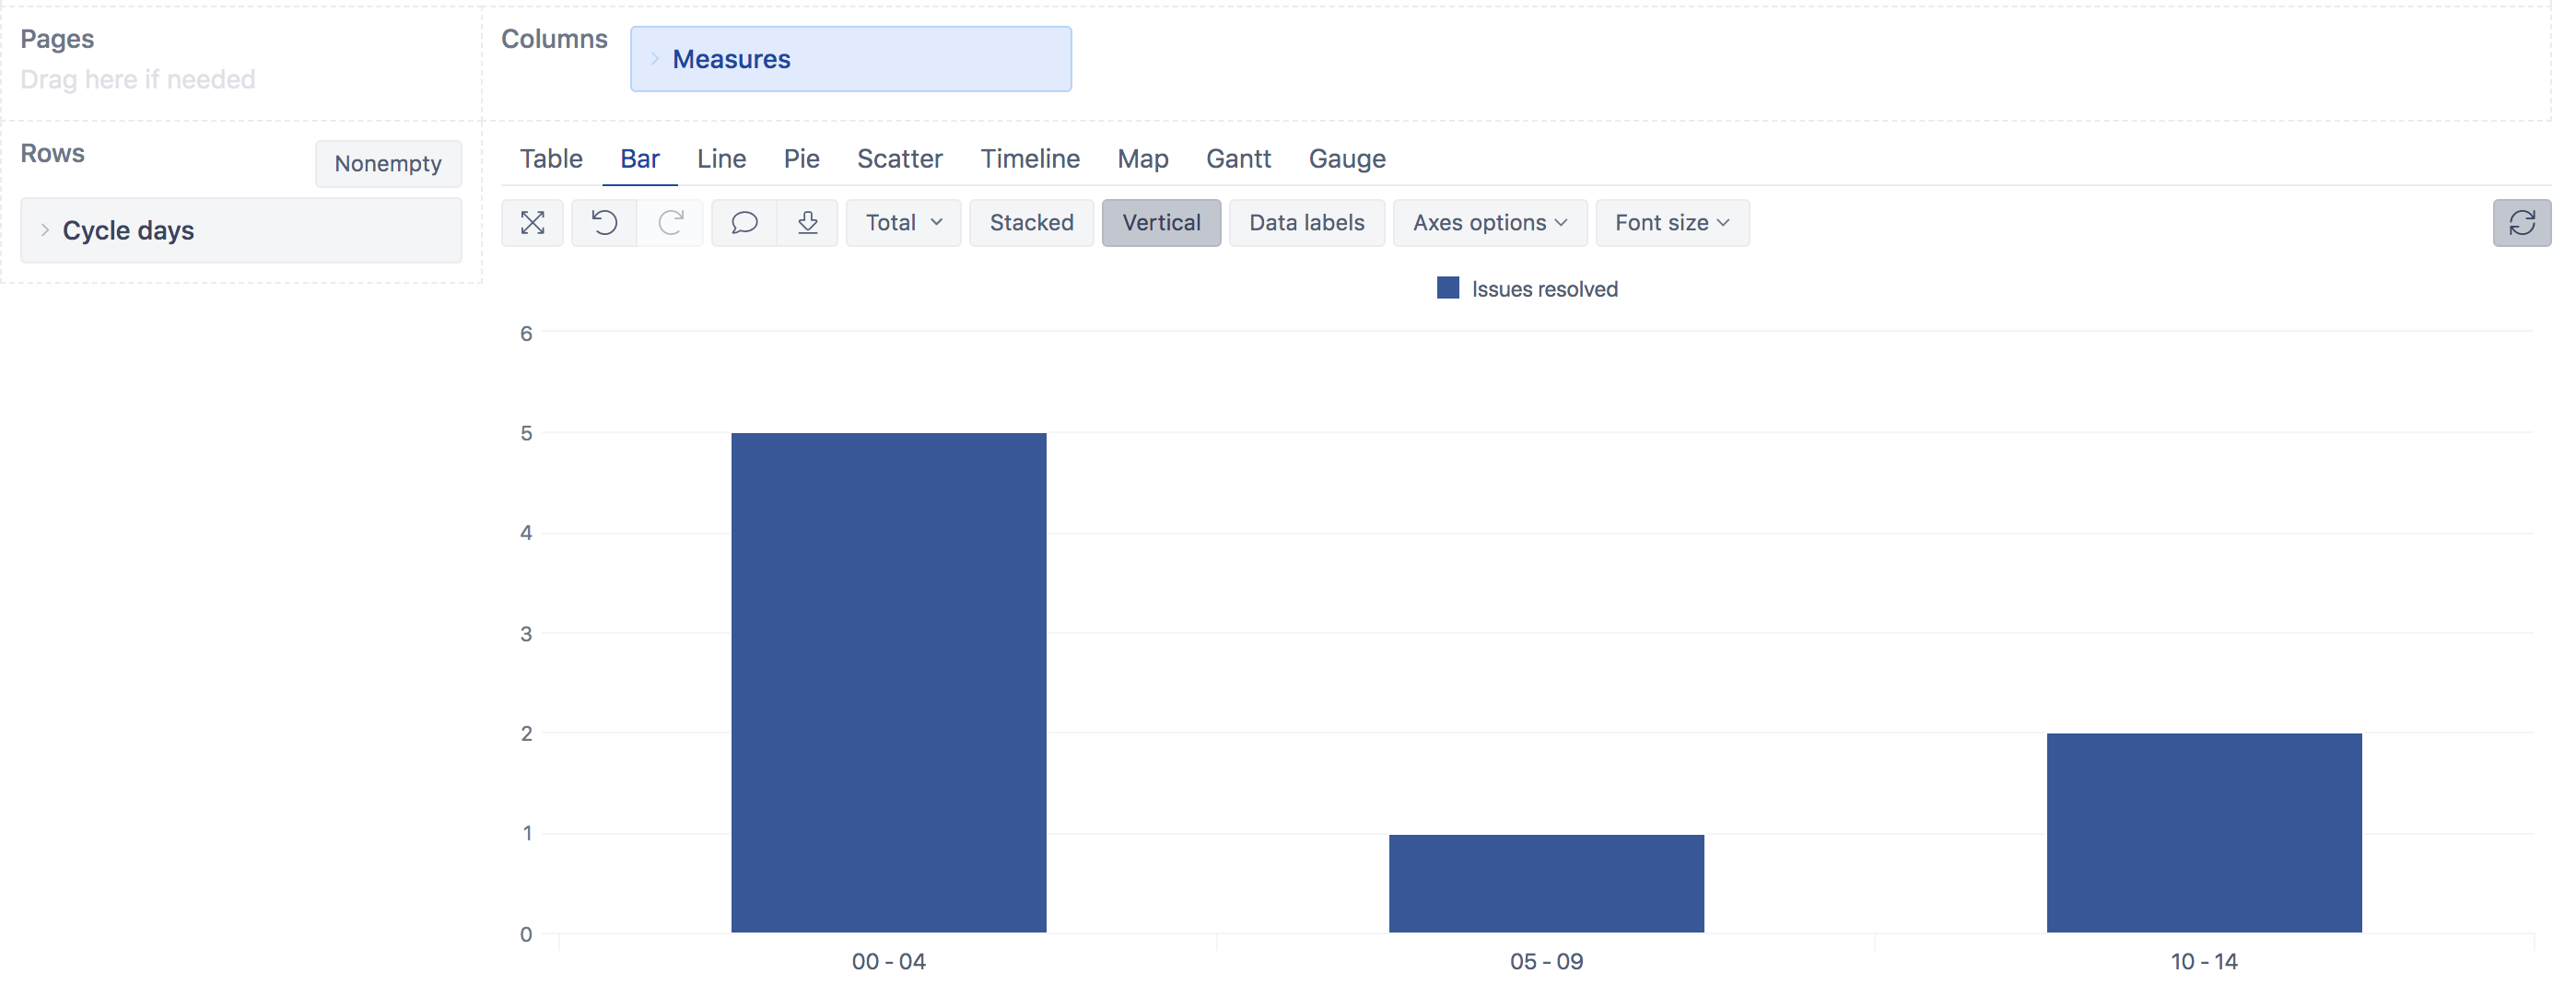
The report could look similar to the one below:
The eazyBI documentation page has more information on JavaScript calculated custom fields - JavaScript calculated custom fields.
Best,
Roberts // support@eazybi.com