Hi,
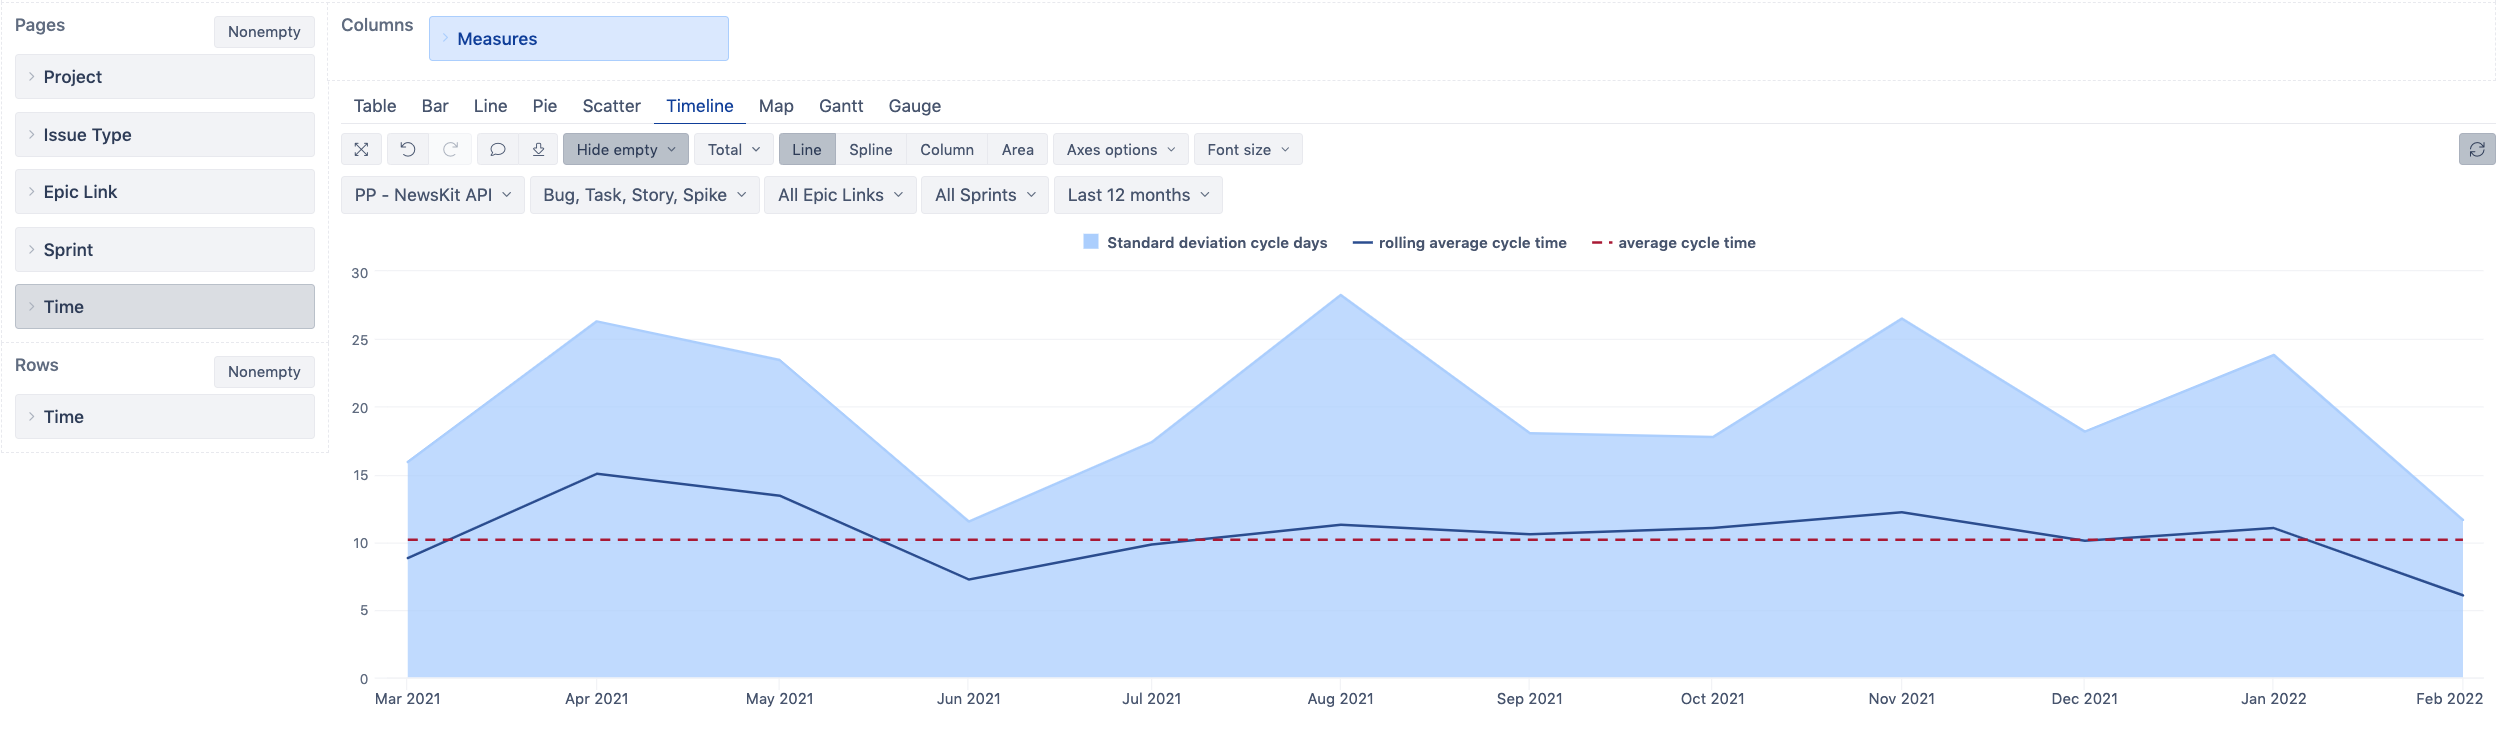
I’m trying to create a graph to show the cycle time per sprint. I’ve followed Control Chart - Lean Agile Tools and now have the cycle time per month (attached image), but am struggling to break it down to be per sprint?
Thanks
Hi,
I’m trying to create a graph to show the cycle time per sprint. I’ve followed Control Chart - Lean Agile Tools and now have the cycle time per month (attached image), but am struggling to break it down to be per sprint?
Thanks
Hi @hannah
Try this demo report: Control chart (Cycle Time) - Issues - Jira Demo - eazyBI
You can remove “Time” dimension from rows, switch to “Line” chart view and use “Sprint” dimension in rows and expand to sprint-level members.
Note that you can use also one dimension both as rows and pages.
Martins / eazyBI
Hello @martins.vanags,
following your instructions leads to a report where the average cycle time is blank, because it’s time bound.
AVG(
  {[Time].CurrentHierarchy.Level.CurrentDateMember.Lag(5):
   [Time].CurrentHierarchy.Level.CurrentDateMember},
  [Measures].[Rolling Average cycle time]
)
Is there a way to obtain a sprint-based average cycle time? I tried getting a time interval based on start and end date of current hierarchy member of the sprint dimension, but it doesn’t seem to work.
regards.
Try this formula:
AVG(
  {[Sprint].CurrentHierarchy.Level.CurrentMember.Lag(5):
   [Sprint].CurrentHierarchy.Level.CurrentMember},
  [Measures].[Rolling Average cycle time]
)
Note that LAG method would look for the 5th member before the current sprint (displayed in report rows) and they are ordered by Sprint IDs.
Martins / eazyBI support