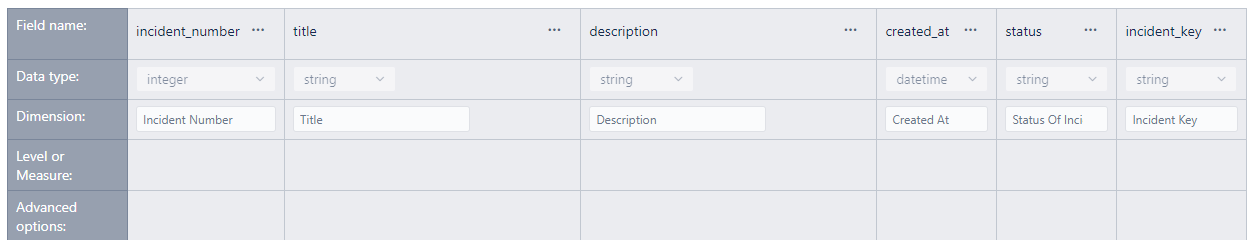
we import data from Pagerduty - like (see picture)
_
Q: How to show a simple flat table:
incident number, creation_date, status, changed_status_date, dateDiff(creation, changed_status)
please, could you explain - if it is possible
we import data from Pagerduty - like (see picture)
please, could you explain - if it is possible
Hi @DKostiuk,
You can create a new custom data cube in eazyBI based on your data. General rules for data mapping are described in the documentation: Data mapping.
There are some tips for deciding when to map a column as a dimension and when as a measure.
Measures
When importing data, one or more measures must hold decimal or integer values. A measure is needed to bind your imported data together in calculations, and eazyBI uses a measure to represent your data in reports from different points of view (dimensions). If a column has numerical values (which are not IDs), then you may import it as a measure. This will allow you to perform mathematical operations (for example, sum up) for this value.
Dimensions
If a column contains key information of the object, like, a business object number or name or a value which could be used to organize data, like business object type, then you can import it as a dimension.
If several columns contain information related to the same object, then you may map them as one dimension with a hierarchy.
Properties
If a column contains descriptive information in free text format and can not be used for data grouping, you can import it as a property.
After you have imported data into your eazyBI custom cube, you can use the function DateDiffDays and create a new custom measure.
best,
Gerda // support@eazyBI.com