Data Table - Add dynamic filter on measure

Hi,

I have create a custom measure, it compute the “age” of each JIRA ticket.
In the table, every ticket older than 90 days has a red background.

Like we have for pages, I wish a dynamic filter (with user selection) to display only tickets older than 30, 60, 90, … days

Is it possible ?

Hello @cdemez,

Eaziest (:smiley: ) way is to click on the column header and use “filter rows” option:
image

You’ll see a dialog like this:
image

And here’s the result:

To change the value (the 100 in my example) just click on the button in the red circle.

I (randomly) used the report Issue resolution days (Lead Time) - Issues - Jira Demo - eazyBI from here Analyze - Jira Demo - eazyBI

Hope it helps!
VasileS.

1 Like

Thanks @VasileS ,

But it does not appear into the Dashboard. I wish to have multiple filters like that, in the dashboard.
Is it possible ?

hello @cdemez

Sorry for my late reaction, I am here just occasionally, if my workload permits! :slight_smile:
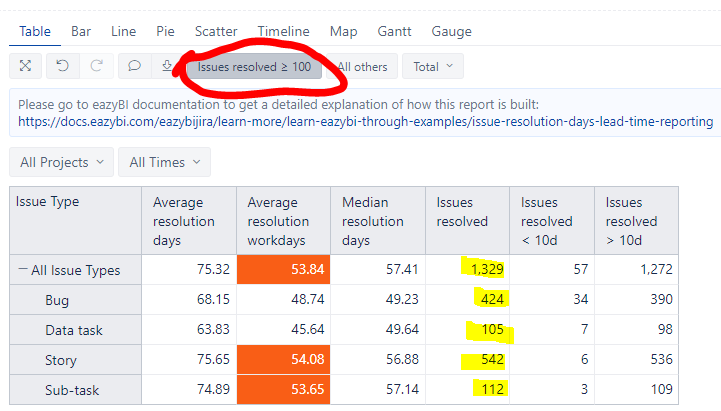
I assume you added your chart into an EazyBI dashboard (not in Jira, with an eazyBI chart/dashboard ‘gadget’). And indeed it is not shown - haven’t noticed this behaviour yet. :confused:

And I have to decline my competence from this moment…

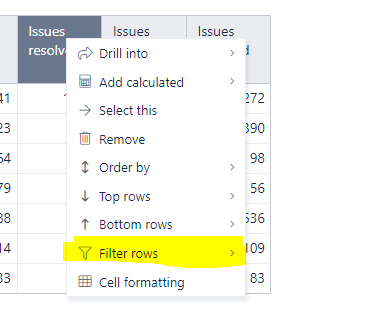
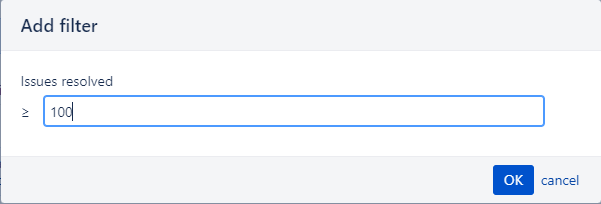
@eazyBI-Staff : is it possible to have a filter on Measures for a chart in a dashboard?.. Kind of “at runtime”, outside the report builder?

Thank you in advance!
VasileS.

1 Like

@VasileS

it is not possible to create dashboard-level filters by measures from the report.

Martins / eazyBI

We have created the following report…