Hi,
I am trying to calculate total time, issues spent in a set of Transition statuses in a month. I am using Days in transitions statuses but it is giving me the wrong figure as in some cases it is also taking previous month time in considerations. For example:
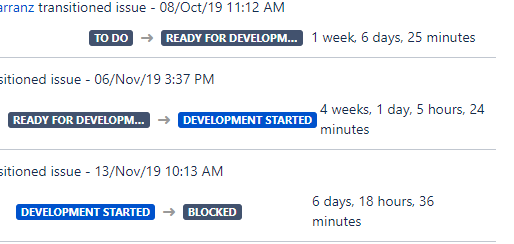
Let say I want to calculate the issue spent in Ready For Development in November, which should be 6 days but it is giving me 4 weeks!!
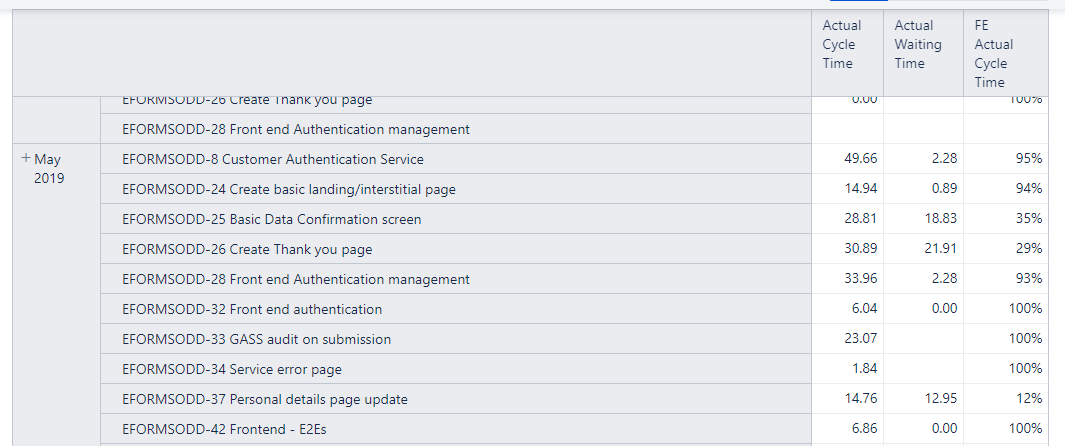
I tried to create my own measure called Actual Days in Transition statuses
IIf(
(DateCompare([Measures].[Transition to status first date],
[Time].CurrentHierarchyMember.StartDate) = 1),
[Measures].[Days in transition status],
DateDiffDays([Time].CurrentHierarchyMember.StartDate,[Measures].[Transition from status last date])
)
It is working on an issue level or for a single month but if I am trying to get this data for Current year or last 3 month, I am getting a Timeout error.
Please help me, I have been working on this report for two days…