I want to build a report on the dynamics of average lead time.
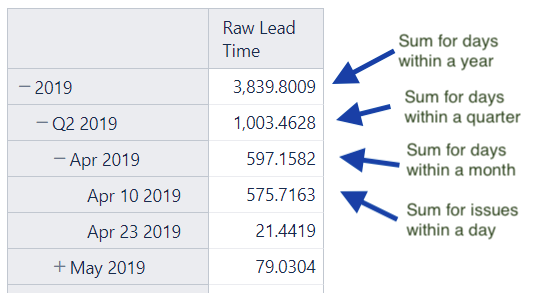
When I tried to just put Issue Close Date in rows and turn on the Raw Lead Time metric, this is what I got:
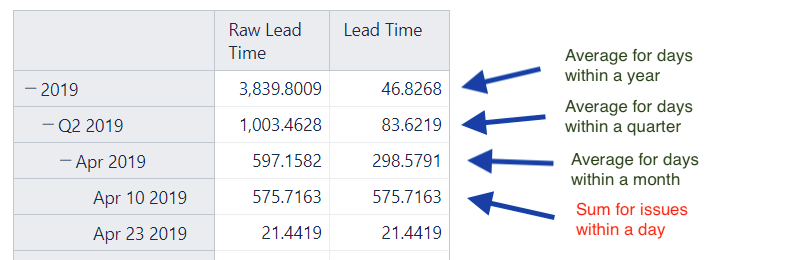
Then I made a calculated metric Lead Time:
Avg(
  Descendants([Issue Close Date].CurrentMember, [Issue Close Date].[Day]),
  [Measures].[Raw Lead Time]
)
The default aggregation is a sum in eazyBI. The average function is more complex as it should consider the order of mathematical operations, and the result changes according to what level you would calculate the average. For example, the average value at the year level would be different if you take a Day value as a basis (total amount divided by 365) or a Month value as a basis (total amount divided by 12).
In your case, it might make sense to calculate the average value over the issues
One option is to update the calculated measure and get Descendants() of “Issues Key” members that have value for lead time in the selected period.
Avg(
   --set of issues with lead time in selected period
  Filter(
    Descendants([Issue Key].CurrentMember, [Issue Key].[Issue Key]),
     [Measures].[Raw Lead Time]  > 0),
  --for those issues calcaulte the average lead time
  [Measures].[Raw Lead Time]
)
Another option would be to adjust the import options so you could use dividing to get the average.
Add one more column “Issue count” that would represent value 1 for each row.
To achieve this, you might adjust the source data or add an additional column using javascript in the import options (Data adjustments using JavaScript - eazyBI)
After data import, you can get an average dividing sum of lead time by the sum of issue count.
[Measures].[Raw Lead Time] /
[Measures].[Issue count]
I would suggest going for the 2nd option as it is more flexible and the new measure “Issue count” would give you additional insight.