Hi,
I would like to specify a diferente cell formating for each row, is possible
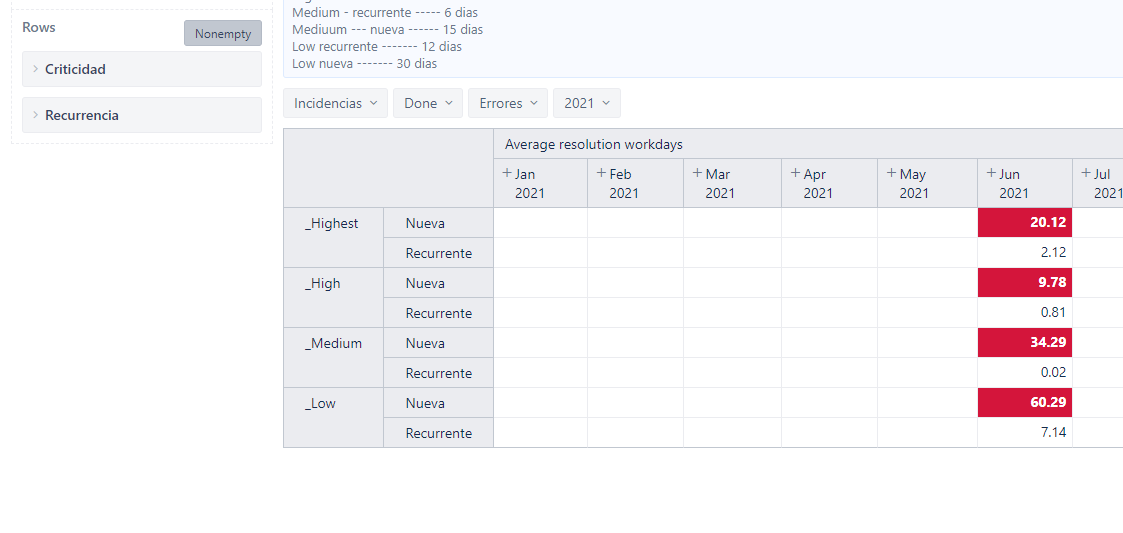
In the capture you can see that I have specify a cell formatig for the first row (_Highest / nueva) and is aplied for all (nueva) rows
Thanks
Hi,
I would like to specify a diferente cell formating for each row, is possible
Thanks
Hi @aelexpuru,
You can use conditional cell formatting to apply different colors to your measure.
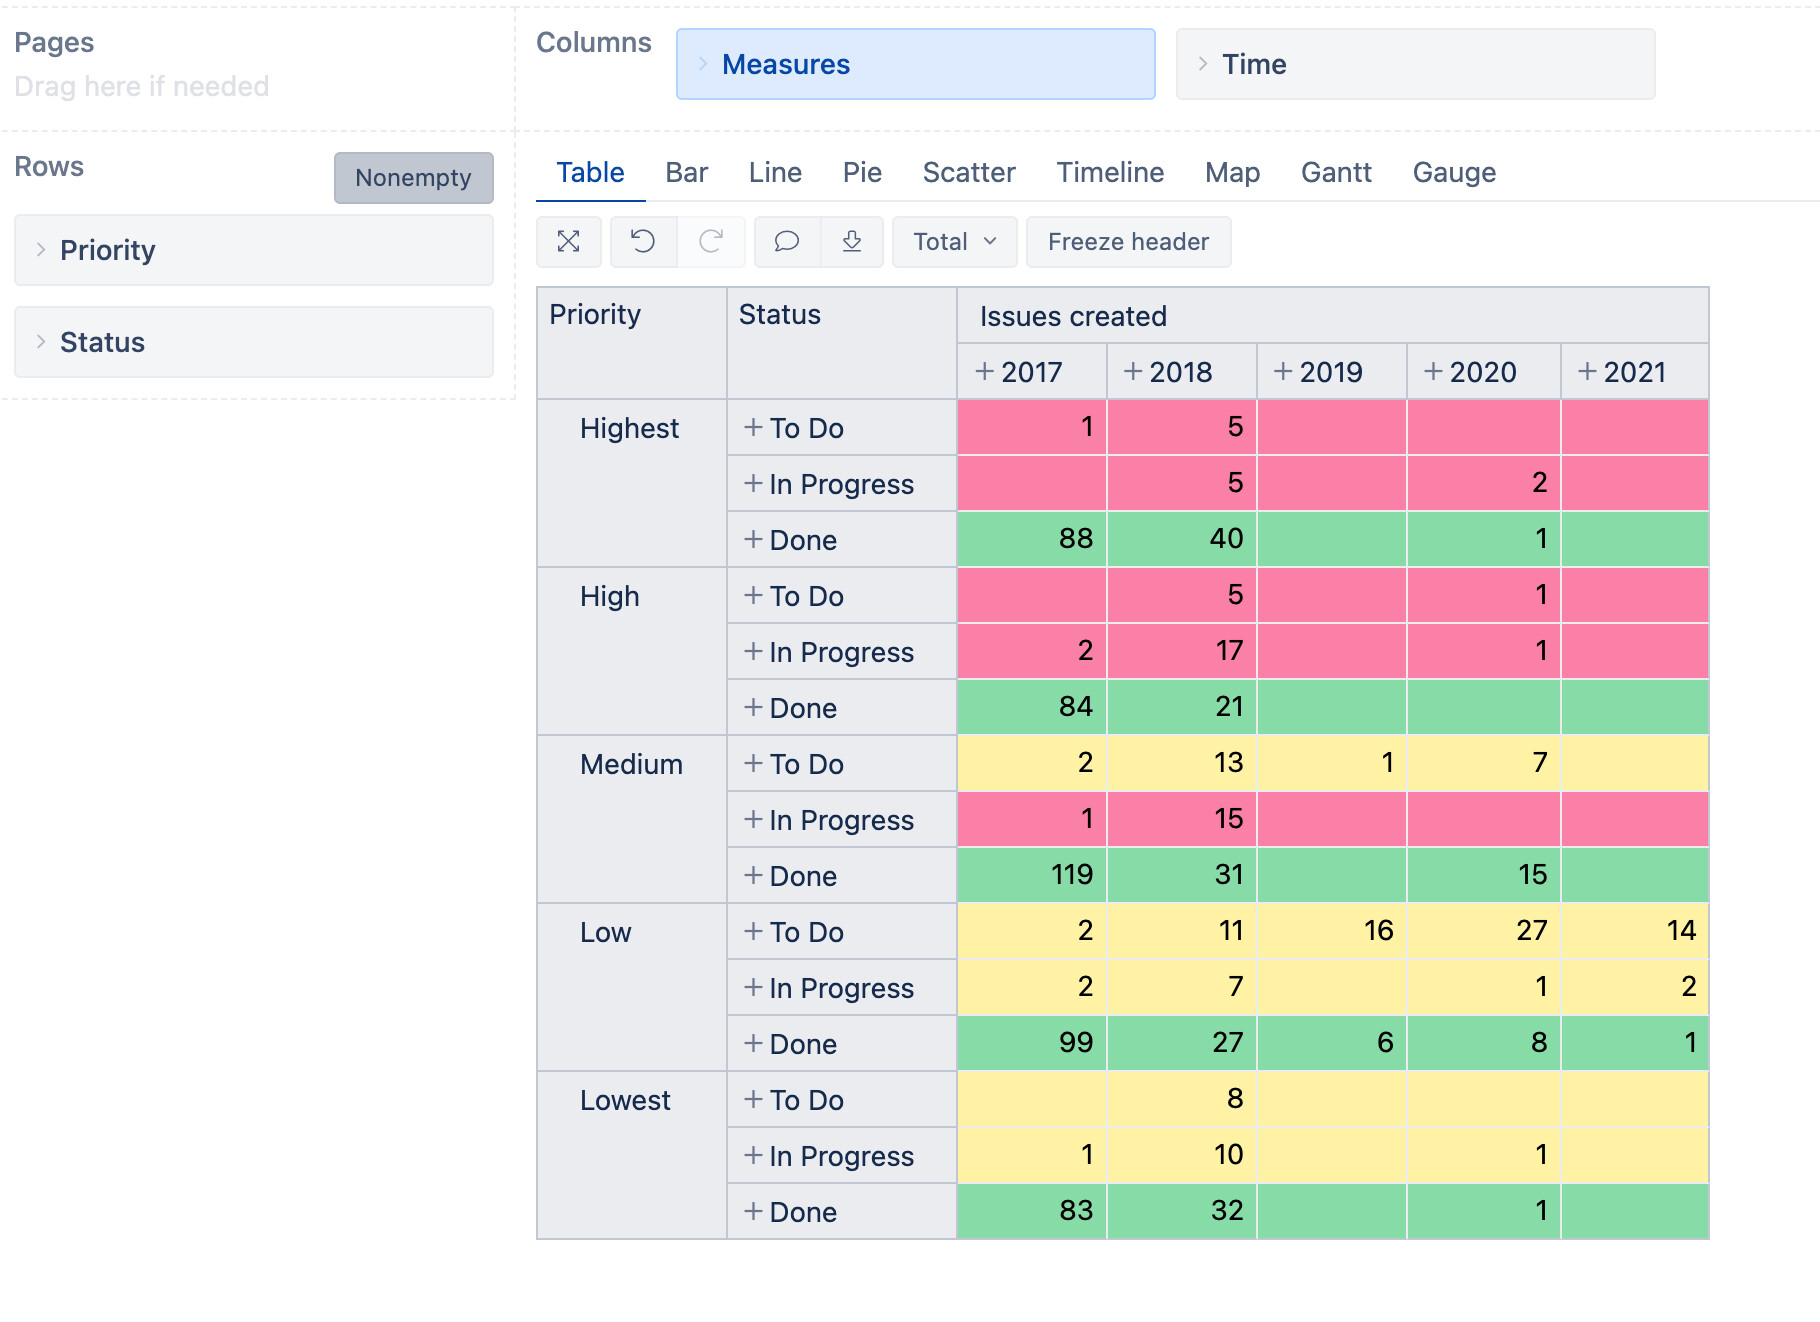
Here is an example from the demo account: Risk chart by status and priority - Issues - Jira Demo - eazyBI
The formula applied for the measure “Issues created” is (change the dimension names to the one you use in your report):
-- color by priority and status
CASE [Status].CurrentHierarchyMember.Name
WHEN "Done" THEN "Green"
WHEN "To Do" THEN
  CASE WHEN
  [Priority].CurrentMember.Name MATCHES "Highest|High"
  THEN "Red"
  ELSE "Yellow"
  END
WHEN "In Progress" THEN
  CASE WHEN
  [Priority].CurrentMember.Name MATCHES "Highest|High|Medium"
  THEN "Red"
  ELSE "Yellow"
  END
END
In the report you can switch the dimensions position and at the end it can look like this:
Kind regards,
Gerda // support@eazyBI.com