Display a specific number of sprints

Hi, I have been using eazyBI for a short time and I have this question that I think is simple:

I have projects with many sprints and I need to be able to visualize in a report the last 5 completed sprints.

In addition to this could I enter an input to get the last X sprint I want? Or would it be necessary to modify the measurement query each time I want to visualize a different number of sprints.

Thank you very much

Hi @JPerez,

You will have to use the Sprint Dimension as a Page:

In this example we use the Current and Last PI which is 26 weeks, but for 5 closed sprints you will use 10 weeks if it’s a biweekly sprint.

Measure for the Sprint Filter.

Aggregate(
  Filter([Sprint].[Sprint].Members,
    NOT IsEmpty([Sprint].CurrentMember.get('Start date')) AND 
    DateBetween(
      [Sprint].CurrentMember.get('End date'),
      '26 weeks ago',
      'Now')
    
))

I hope this helps.

Eli Solutions

1 Like

Thank you very much Eli, you have been a great help to me.

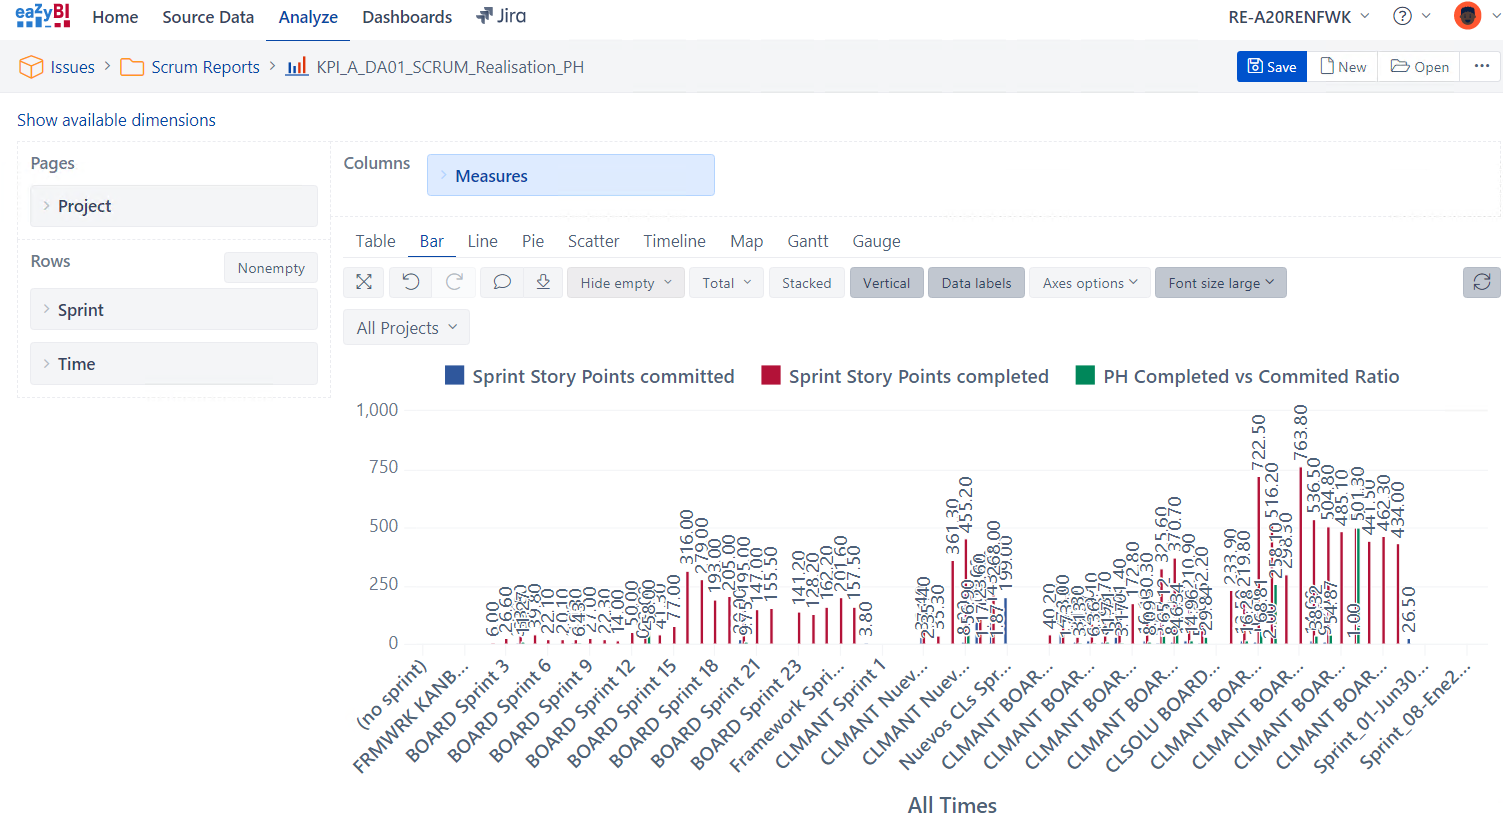
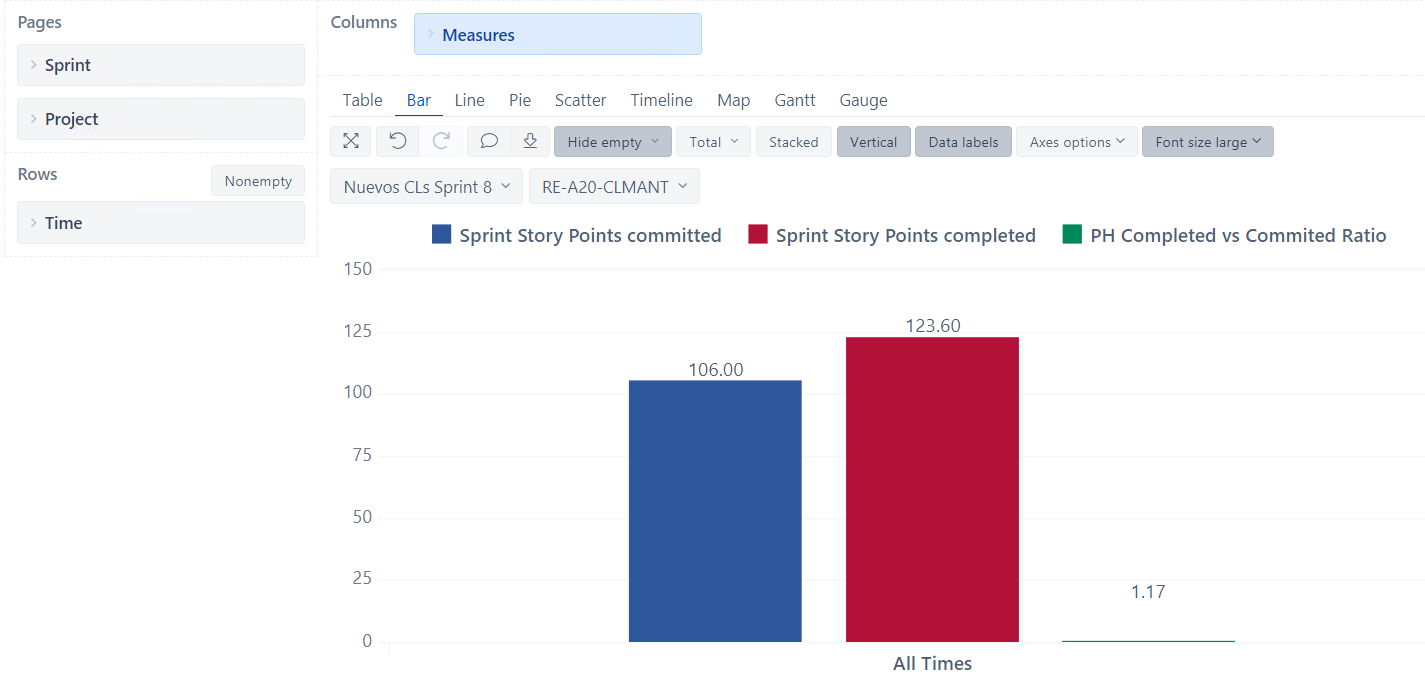
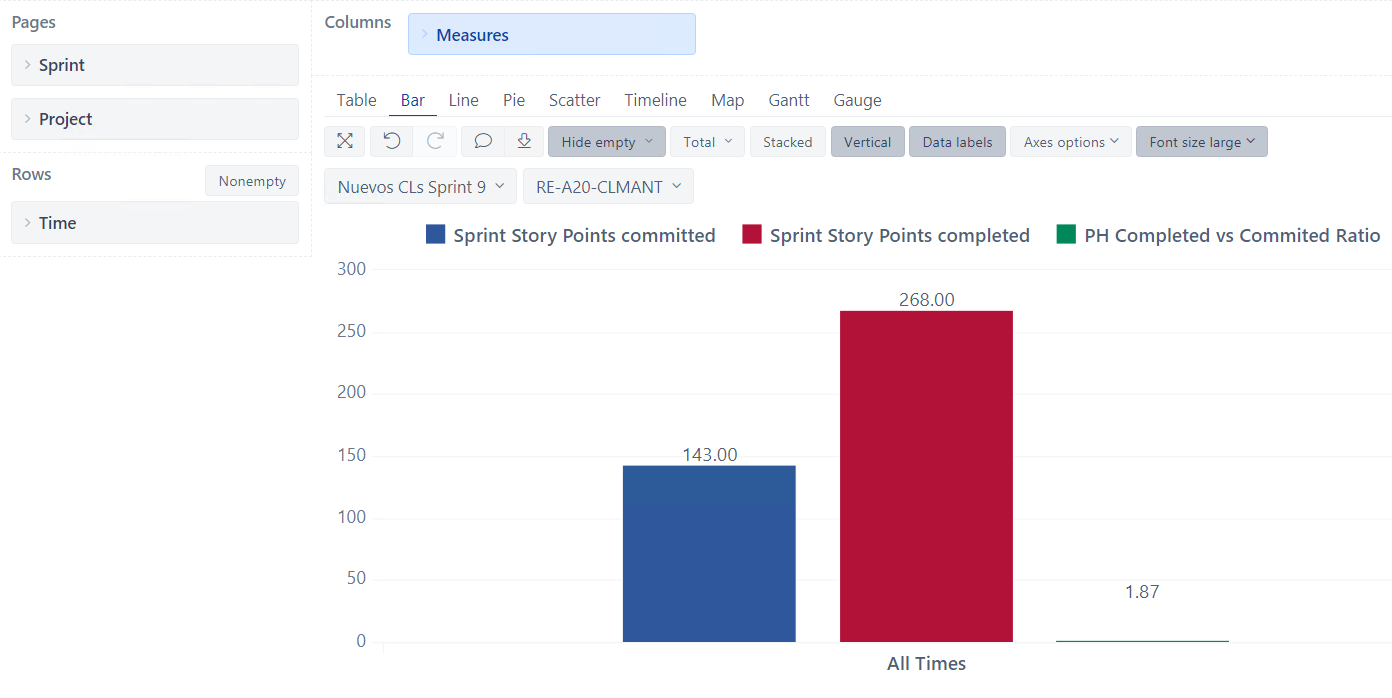
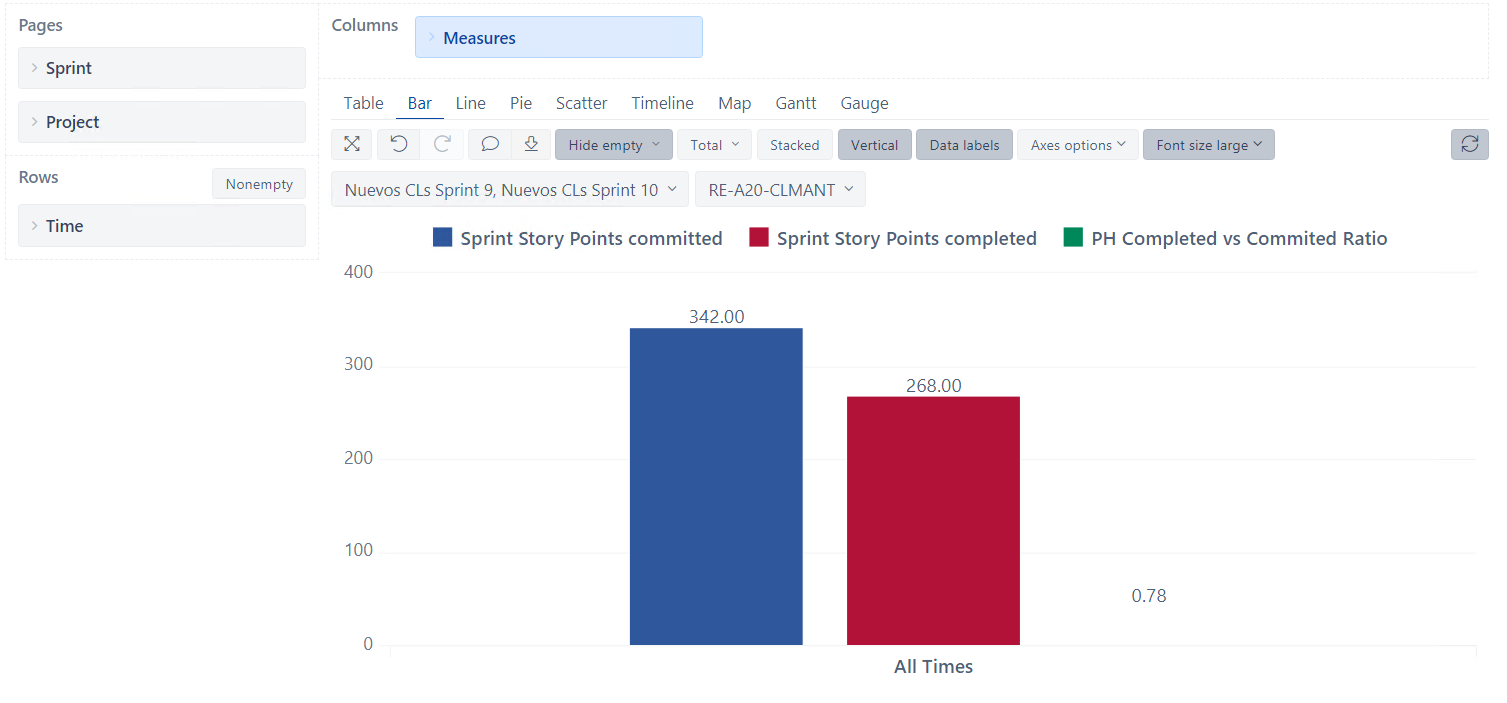
Now I only have one problem to solve and it is that if I want to choose two different sprints to compare them in the same report (using sprint as page). if I select them separately its okey but if I put them together, their values are added instead of showing them separately in the X axis. I show you one example.

Thanks in advance

@JPerez

Please find related community post on how to filter the report for last 5 closed sprints:

And note the option to use the same dimension in columns and page filters.
https://docs.eazybi.com/eazybijira/analyze-and-visualize/create-reports#Createreports-Pagedimensions

Martins / eazyBI support