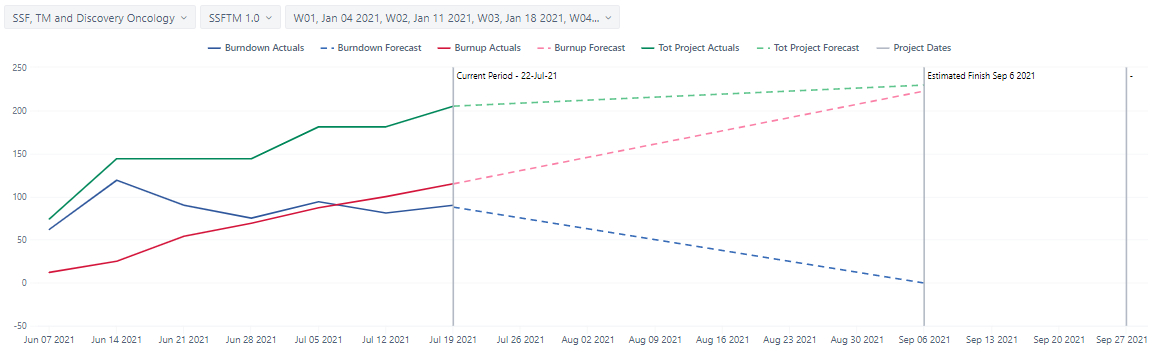
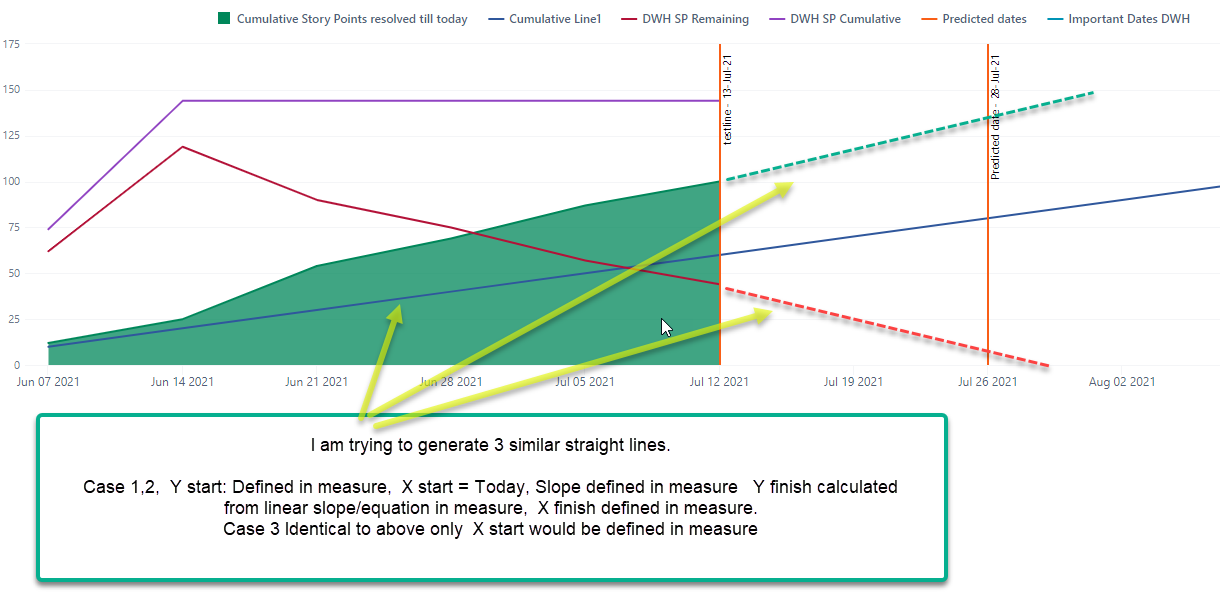
I would like to display several straight lines in burnup chart. In this case I do not want to use the Predicted dates that you have in EazyBI. I would like straight lines where I can define the x,y start and xy finish. See example below. I do see sophisticated extrapolations in EasyBI, in this case I would like simplicity of manually Then adjusting visually to best fit the data. It must be simple as I am simple PM and not so good with EazyBI language! Thanks for any guidance.
I MIGHT be able handle more advanced approach. For example: I manually enter a a slope in measure and use linear line to calculate the X,Y finish points. or/and the starting Y point = cumulative story points completed at today.
Hi @DonHamp,
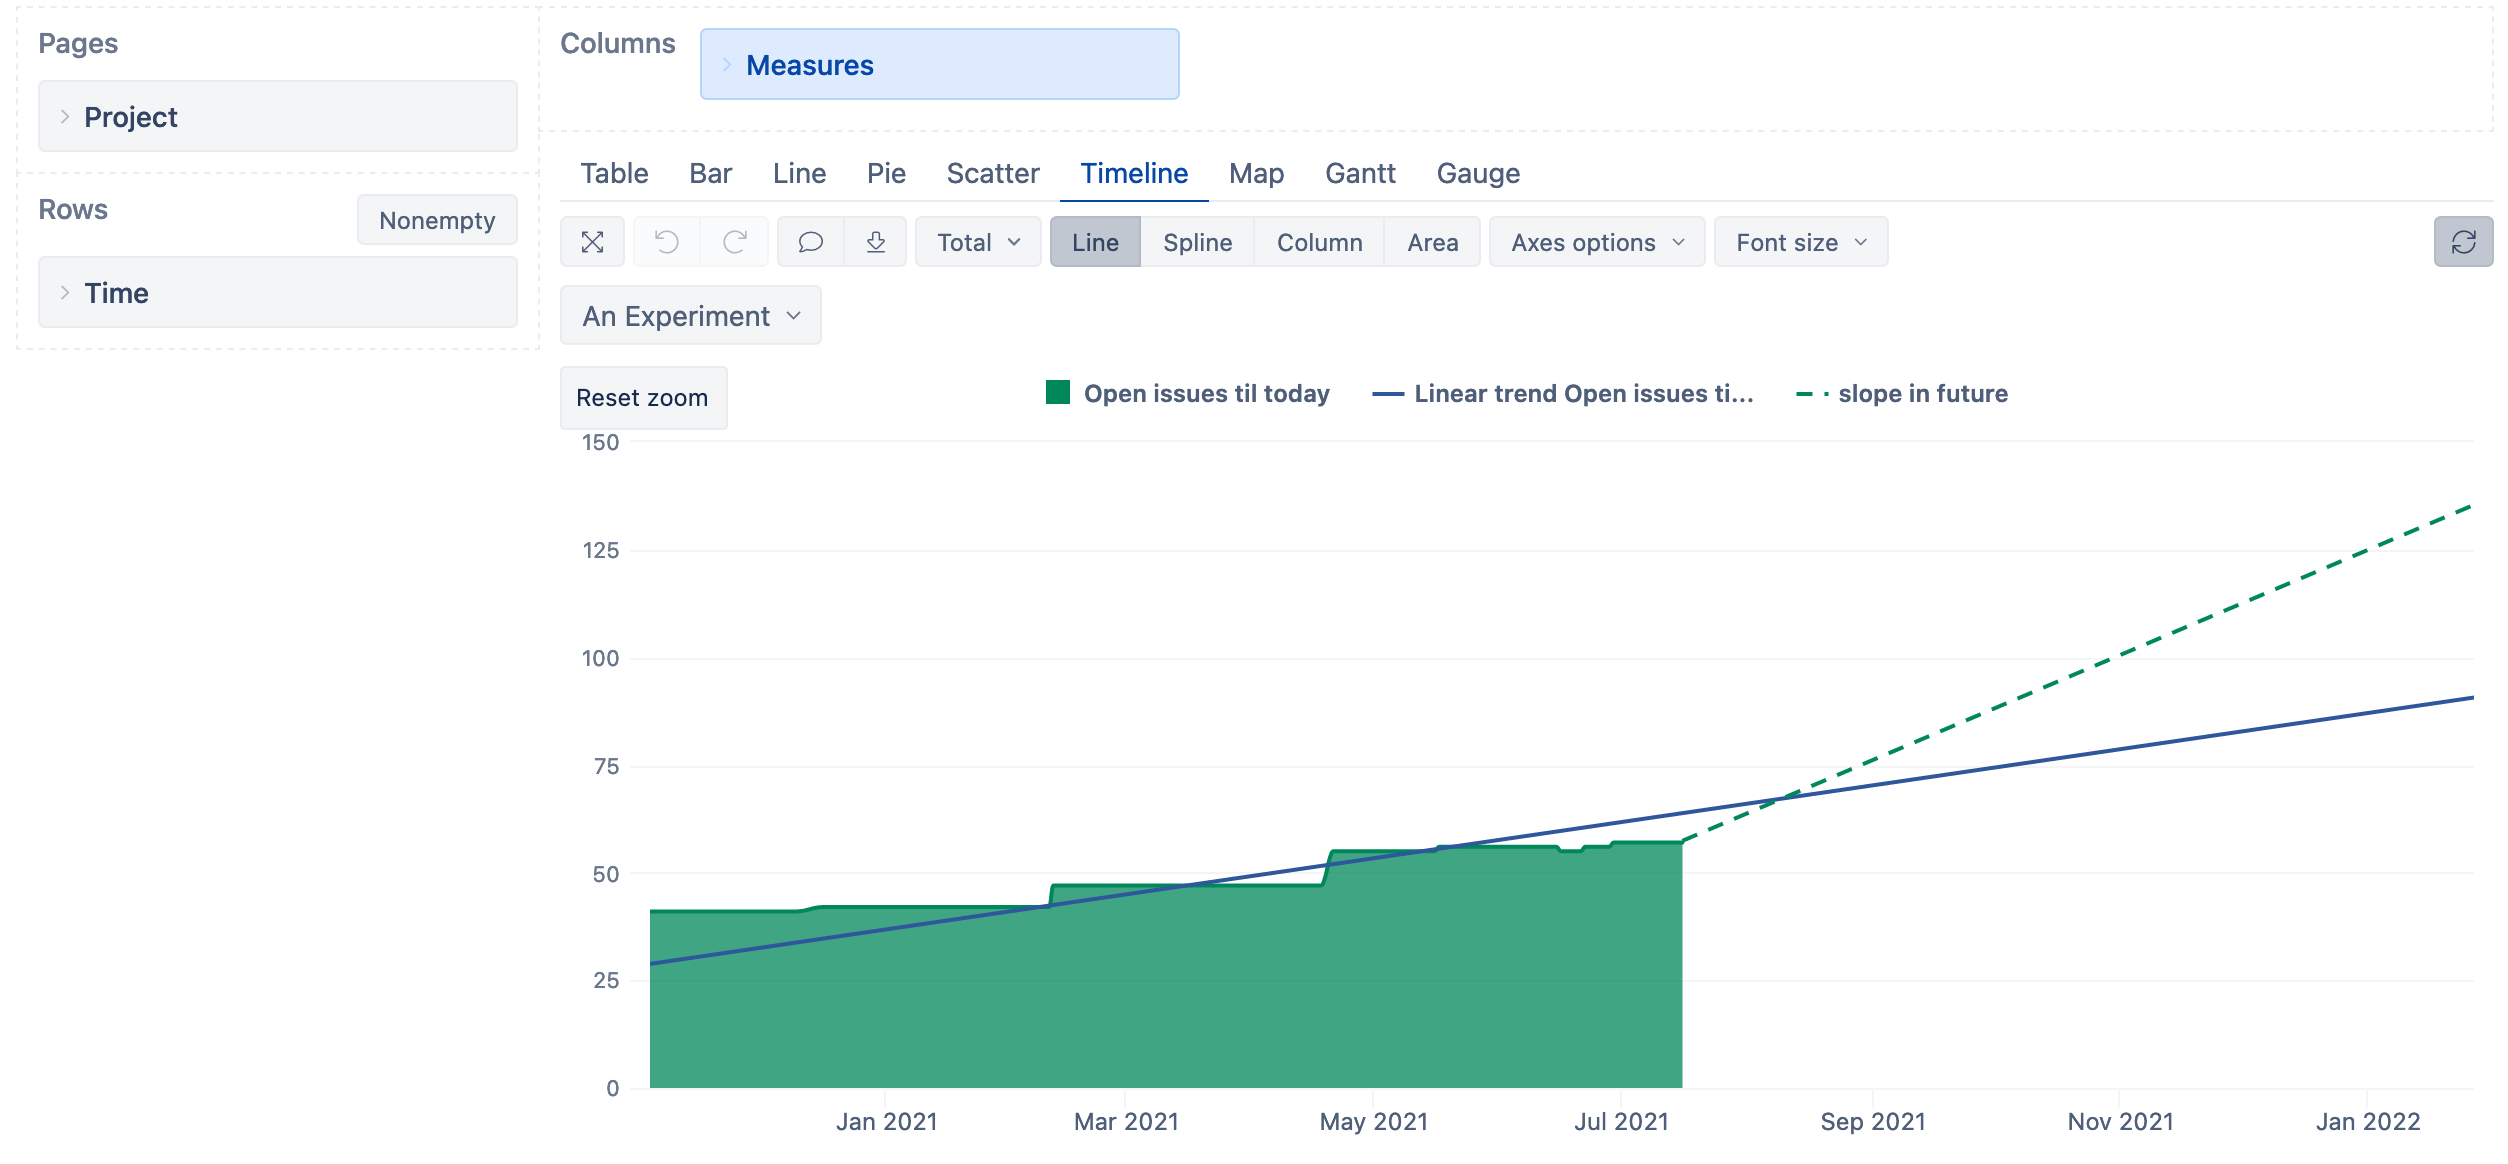
Here is a formula that would draw a custom slope for the future. By changing the coefficient you can make it steeper or turn ‘down’ by setting it negative:
CASE WHEN -- check that we are drawing the line starting from today and into future
DateInPeriod(
  [Time].[Day].CurrentDateMember.StartDate,
  [Time].CurrentHierarchyMember)
OR
  DateCompare(
    [Time].CurrentHierarchyMember.StartDate,
    now()
  ) >= 0
THEN
  Val(([Measures].[Open issues], [Time].[Day].CurrentDateMember)) -- measure from which to start; in this case Open issues
  + 0.4 * -- coefficient you can change to change the slope
  DateDiffDays( -- how far in future we are
    [Time].[Day].CurrentDateMember.StartDate,
    [Time].CurrentHierarchyMember.NextStartDate
  )
END
Lauma / support@eazybi.com
Thank Lauma, what you posted was educational and helpful. I tweaked it somewhat. Here is graph and code. I hope it will be helpful for someone. I know there is more elegant way to pick starting y value… but beyond my skill level. I appreciate time you took to reply
— This is basic draw a line from today to preferred finish date
– It can be used with any forecast line it requires three parameterrs y value, slope and end date
– The line stops at the [Measures].[Estimate Finish Date]
– Slope of 1 = 1 story pt per day or 7 story pts per week
CASE WHEN – check that we are drawing the line starting from today and into future
DateBetween([Time].CurrentHierarchyMember.StartDate, --if Current row date is
DateAddDays([Time].[Day].CurrentDateMember.StartDate,-7), – between 7 days before today
[Measures].[Estimate Finish Date]) – and this manually entered date then…
THEN
106 – measure from which to start look at chart to pick date
__ + (2.2) * – coefficient you can change to change the slope
– Note y value and slope interact in first week after today so have to adjust both
– to get a good fit. Start with y-value first
DateDiffDays( – how far in future we are
[Time].[Day].CurrentDateMember.StartDate,
[Time].CurrentHierarchyMember.NextStartDate
)
END