Hi All,
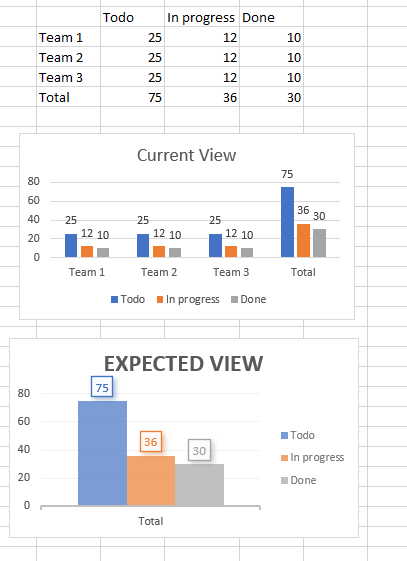
using the data in the image I am able to create bar chart like the one in current view .
But I have to create a chart like Expected view in the image below.
can some one help me to create Expected view chart to display only the total value and not individual team value
Got it resolved using defines measures.
Aggregate({[Team 1].[Todo],[Team 2].[Todo],[Team 3].[Todo]
})
1 Like
