Good morning guys. My first question here on the forum.
I would like to build a Histogram with the Cycle Time of my Downstream Stream. This report will have the x axis with the days of the Cycle Time and the y axis will have the issue number with the same Cycle Time.
We will have a variable with the downstream flow.
I tried to use Age interval and Resolution interval dimension, but it was not possible as it adds the opening date to the resolution date.
Can anyone help me?
Hi @Kleber_Rocha ,
I recommend looking into the Cycle day interval dimension. It is based on a JavaScript calculated custom field, and you can see the example on the eazyBI documentation page - JavaScript calculated custom fields.
Update the values in the statuslist array to reflect your cycle statuses. Then update the desired interval settings. After updating the eazyBI advanced settings with the parameters, you can select it for import in the eazyBI import options “Custom fields” tab.
See more details on how and where to define JavaScript calculated custom fields on the eazyBI documentation page - JavaScript calculated custom fields.
Best,
Roberts // support@eazybi.com
1 Like
Thank you Roberts! 
Hi Roberts,
I’m in need of one last help: When I use the dimension I created via javascript, the result comes to None as the image below:
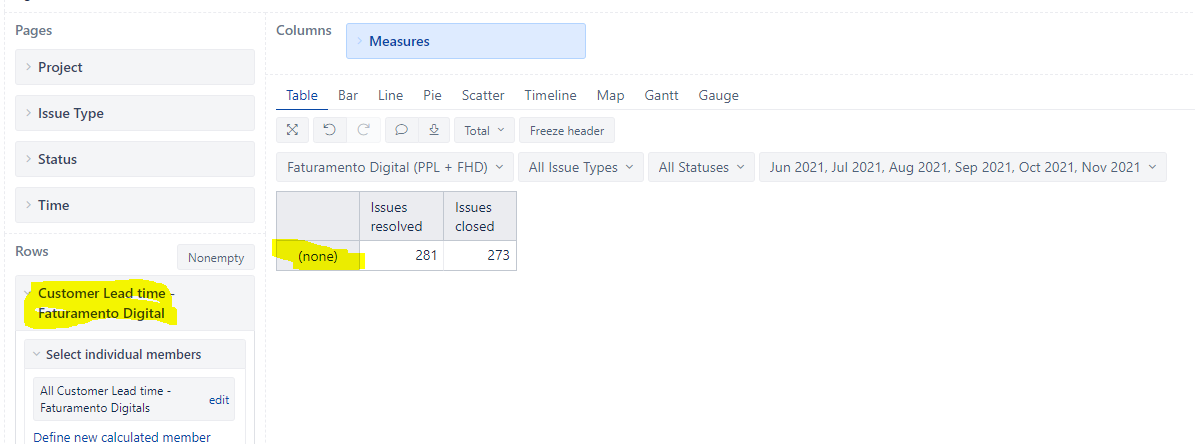
Hi @Kleber_Rocha ,
Please share the parameters you used to define the dimension “Customer Lead time - Faturamento Digital” and the name of the Status that you want to consider.
Best,
Roberts // support@eazybi.com