It seems that the the dynamic Y axis range on Timeline and Line charts always includes 0. I recognize that a lot of the time, this is what you want, because it keeps the absolute quantities in perspective. It’s easy to miss when a chart doesn’t begin at 0, and viewers can get the wrong idea about the data.
But sometimes, the absolute quantities are not very helpful in the first place. This is quite often the case with timeline/line charts where the measures are very far away from zero and relatively close together.
Here is an example of such a chart, where the measures are close together but far away from zero:
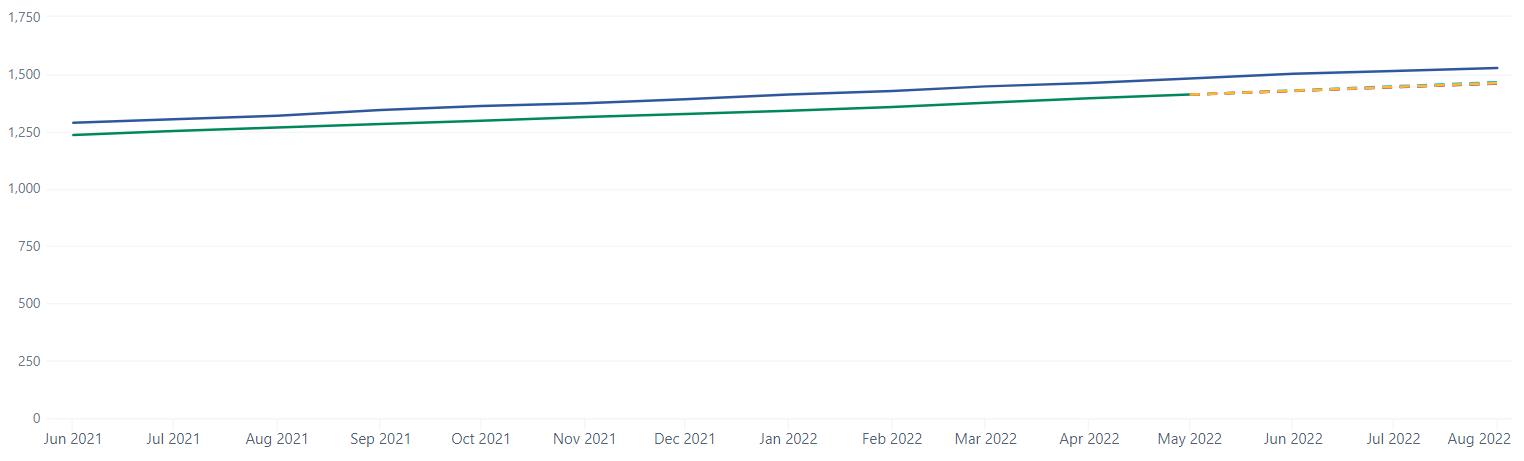
The most important information in this chart - the four dotted line measures - is completely obscured. (You can’t even tell that there are four of them!)
Of course, to solve this in a specific case, we can manually set the Y axis minimum ourselves:
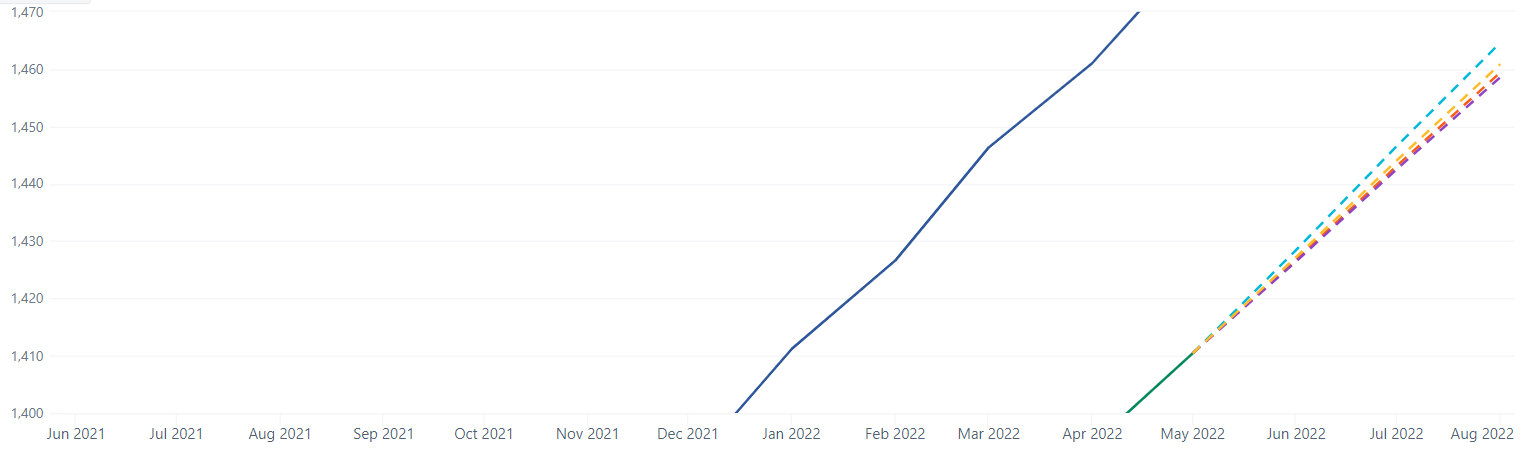
We can more clearly see how those four dotted-line measures behave now, but this doesn’t actually help us much. When the data is updated, or if we use page selectors to view a subset of the data, it may move outside our hard-coded window, and we will have to manually update the Y axis range ourselves. We miss out on too much functionality by manually setting the range.
For data sets where the measures are all closer to zero, the default behavior of fitting the Y axis range to the data works just fine. We can slice and filter the data, and the Y axis range automatically adjusts to fit the data neatly. But it always includes 0 in the range.
The feature request is for some kind of option to disable this “always include 0” behavior on the dynamic Y axis scaling. The default behavior would be to always include 0 in the range, just like it currently works. The alternate behavior (option toggled) would be to allow the Y axis minimum to dynamically scale, even if the minimum it chooses doesn’t include 0 in the axis range.