Hi
I am trying to get an average dynamically based on the column filter I choose
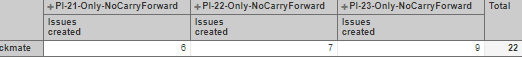
Rows : Team
Column Filter : Program Increment
Column Value : Issues created
I have filters to pick Program increment in the column view, based on that I want the dynamic avg .
This report will be used to understand how many issues in each program Increment a team have completed and understand avg issues team can handle.
Want to see an AVG as 7.3. (please note I can write calculated measure for this but want the avg to change based on number of program increment I choose in the filter)
I have cloud version of EAZYBI but dont see the latest calculated options released as part of EAZYBI 5.0 version. Please let me know how to calculate average for the dynamic view of the columns seen.
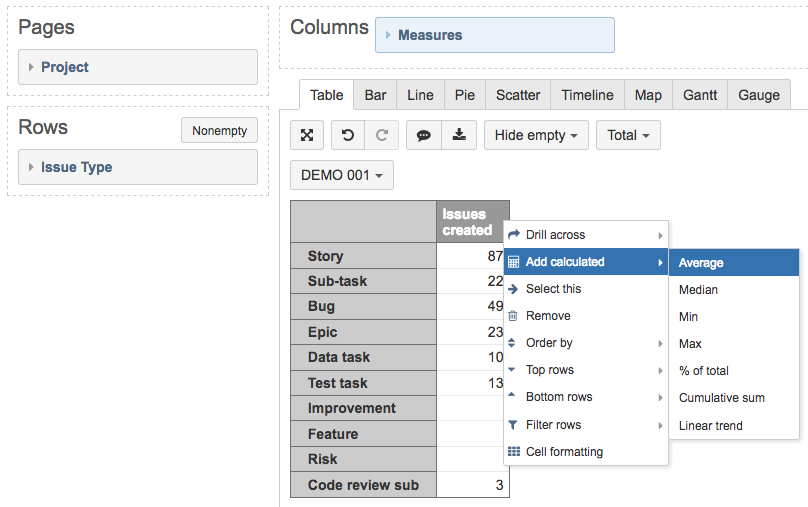
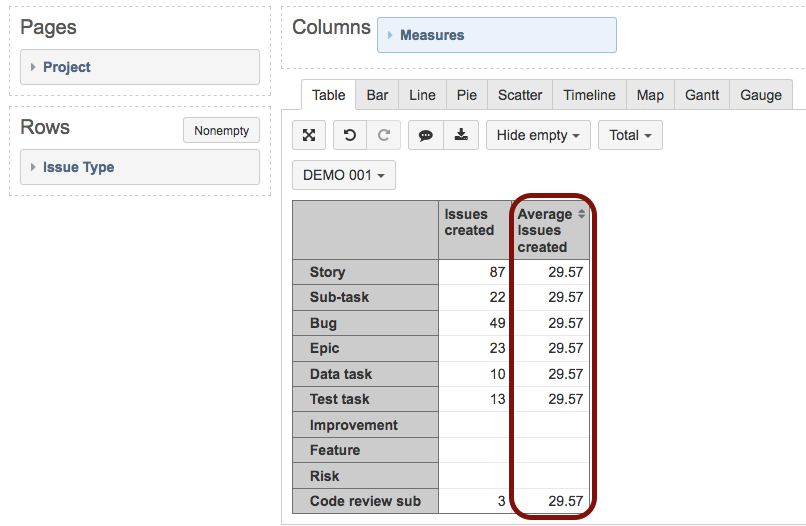
eazyBI is always the latest version on the cloud. The standard calculations you mentioned can be found by clicking on the measures header in the table. Unfortunately, they won’t work as expected if there is another dimension in columns.
I would suggest moving the Program Increment dimension to rows. You can leave the Team dimension in rows or move it to pages for filtering purposes. After that, you can click on the header of the measure “Issues created” and select the “Add calculated” option and then “Average”. Please see the attached pictures.