Hello - I’m attempting to use the email / pdf functionality in EazyBI to send a report to stakeholders highlighting issues that have been sent over the past week.
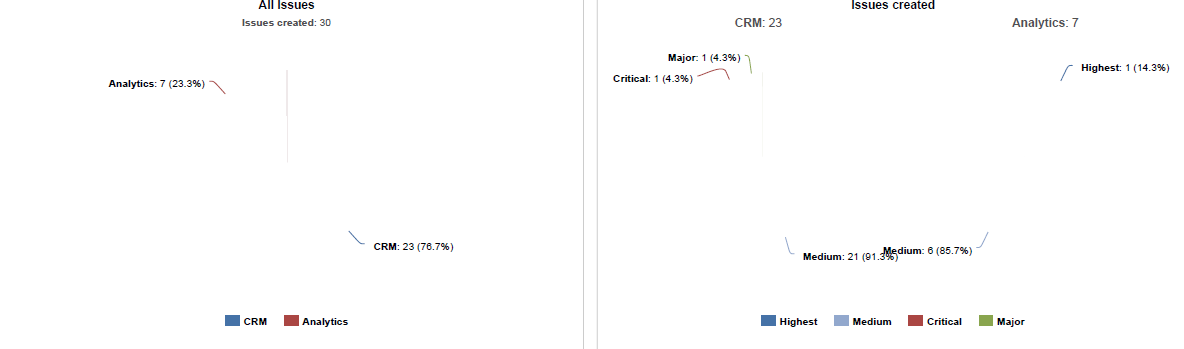
I’m able to view the table report that shows the details around what’s been submitted, but any pie charts or bar charts are not rendering the actual “pie” or “bar” graphic, even though the data / name labels are - see below.
Has anyone seen this before, or have any advice about how I can resolve this?
Thanks!