I need to create a new report to get a monthly line graph to show the elapsed time in days for a JiRA user story or defect to move from a particular status to another status (Eg : Release backlog -> Route to Live -> Live), the line graph should reflect
- Total time taken by a User story from Release backlog to RTL to Live
- Average time taken by all the User stories which went to Live in that month.
- Only consider the user stories when the Status of the Ticket is “Live”
Hi Sabina,
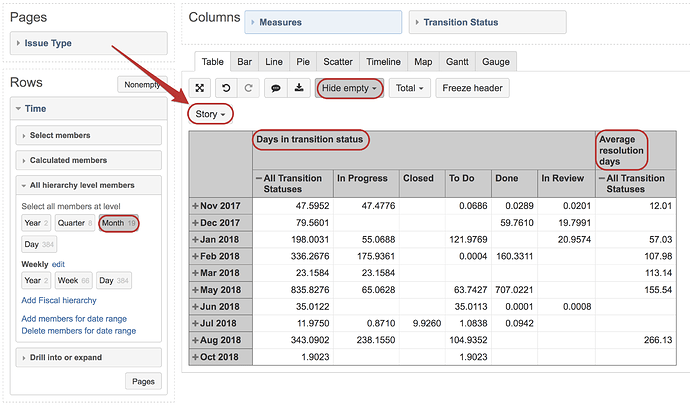
There is default Measure Days in transition status which would show total days spent in status that is selected from Transition status dimension. Used together with Time dimension you would see how many days issues spent in each of the statuses grouped by the period when they transitioned out of that status.
Additionally, assuming that when issues go to Live they are marked as resolved, you can use the Average resolution days to see how many days issues took to get to resolved. On the Time dimension the resolution days would be displayed on the issue resolution date. This would show only for all Transition statuses, so you can hide the empty columns from report. See example below
Let me know if you have further questions regarding this!
Lauma / support@eazybi.com
Hi Roberts. Just checking, did you get my email earlier in the week? If not I will paste in here again
Hi @dwightman!
You had a conversation with @roberts.cacus here Reports often timeout at month end - #4 by roberts.cacus, but there is no follow-up nor have we seen an e-mail from you in the support inbox. Please resend the questions either on the post or to the support e-mail.
Lauma / support@eazybi.com
