Hi Team,
Looking to build a burn up chart that shows EPIC ROM Days(All estimates are at Epic level) over Fixed timeline with 2 week sprints starting Feb 27th 2025 and ending on 11/27/2025. Can someone help? Thank you.
Hi,
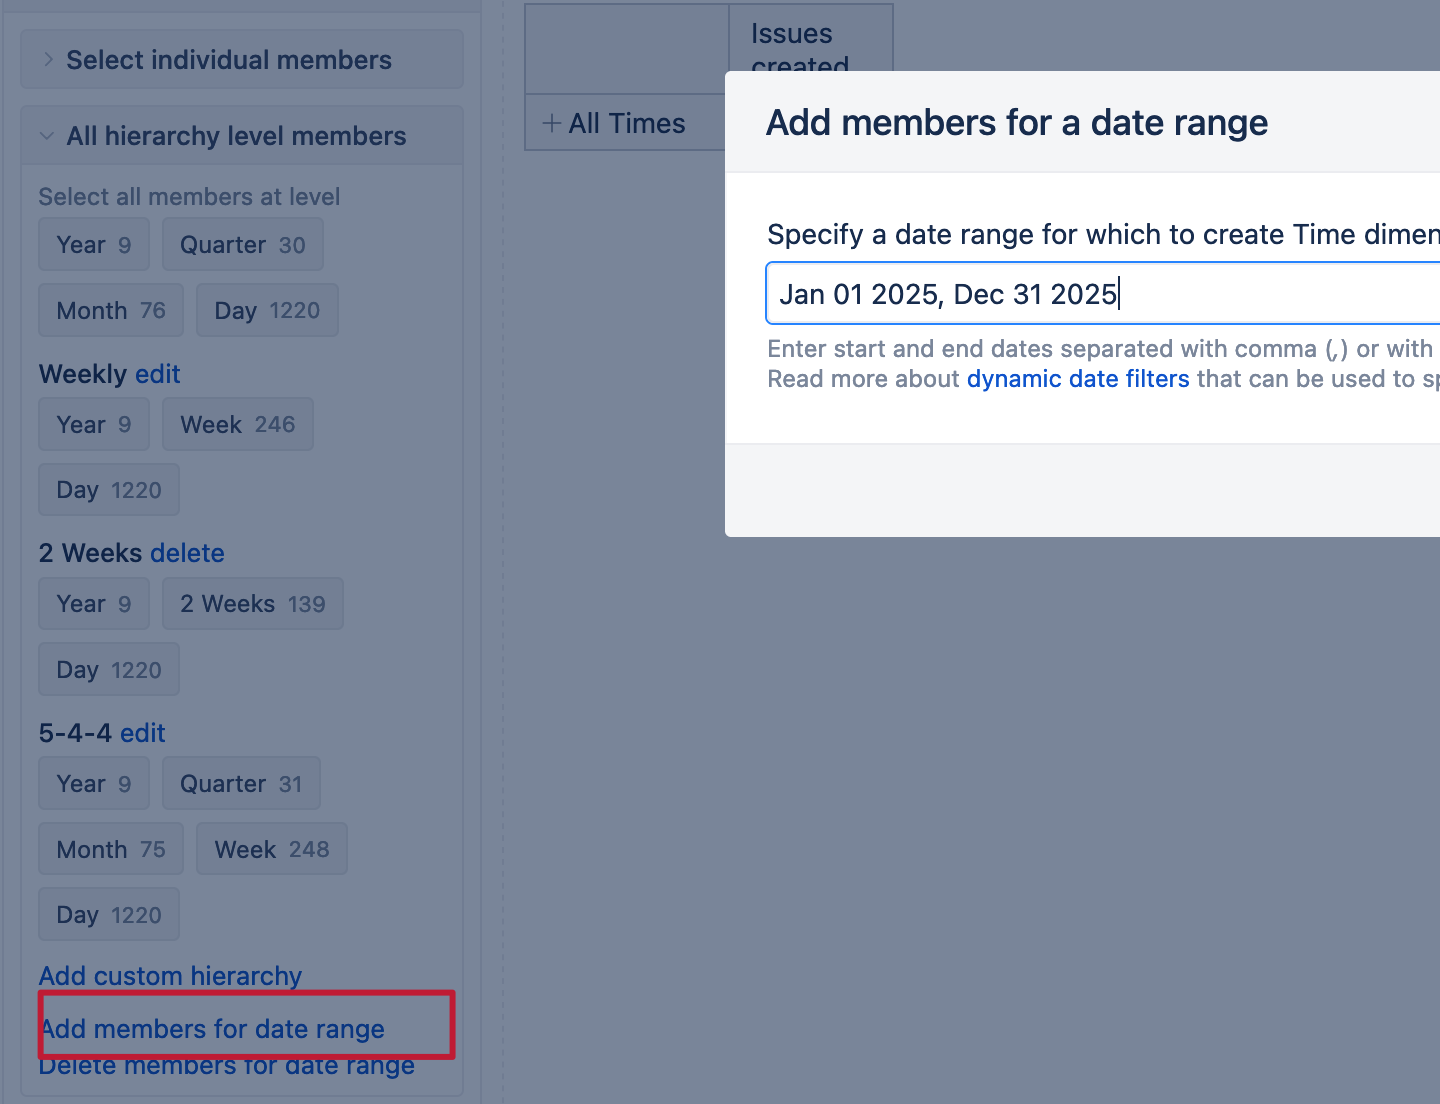
the recommended way to build the burn-up chart is to use the bi-weekly time dimension showing the future periods.
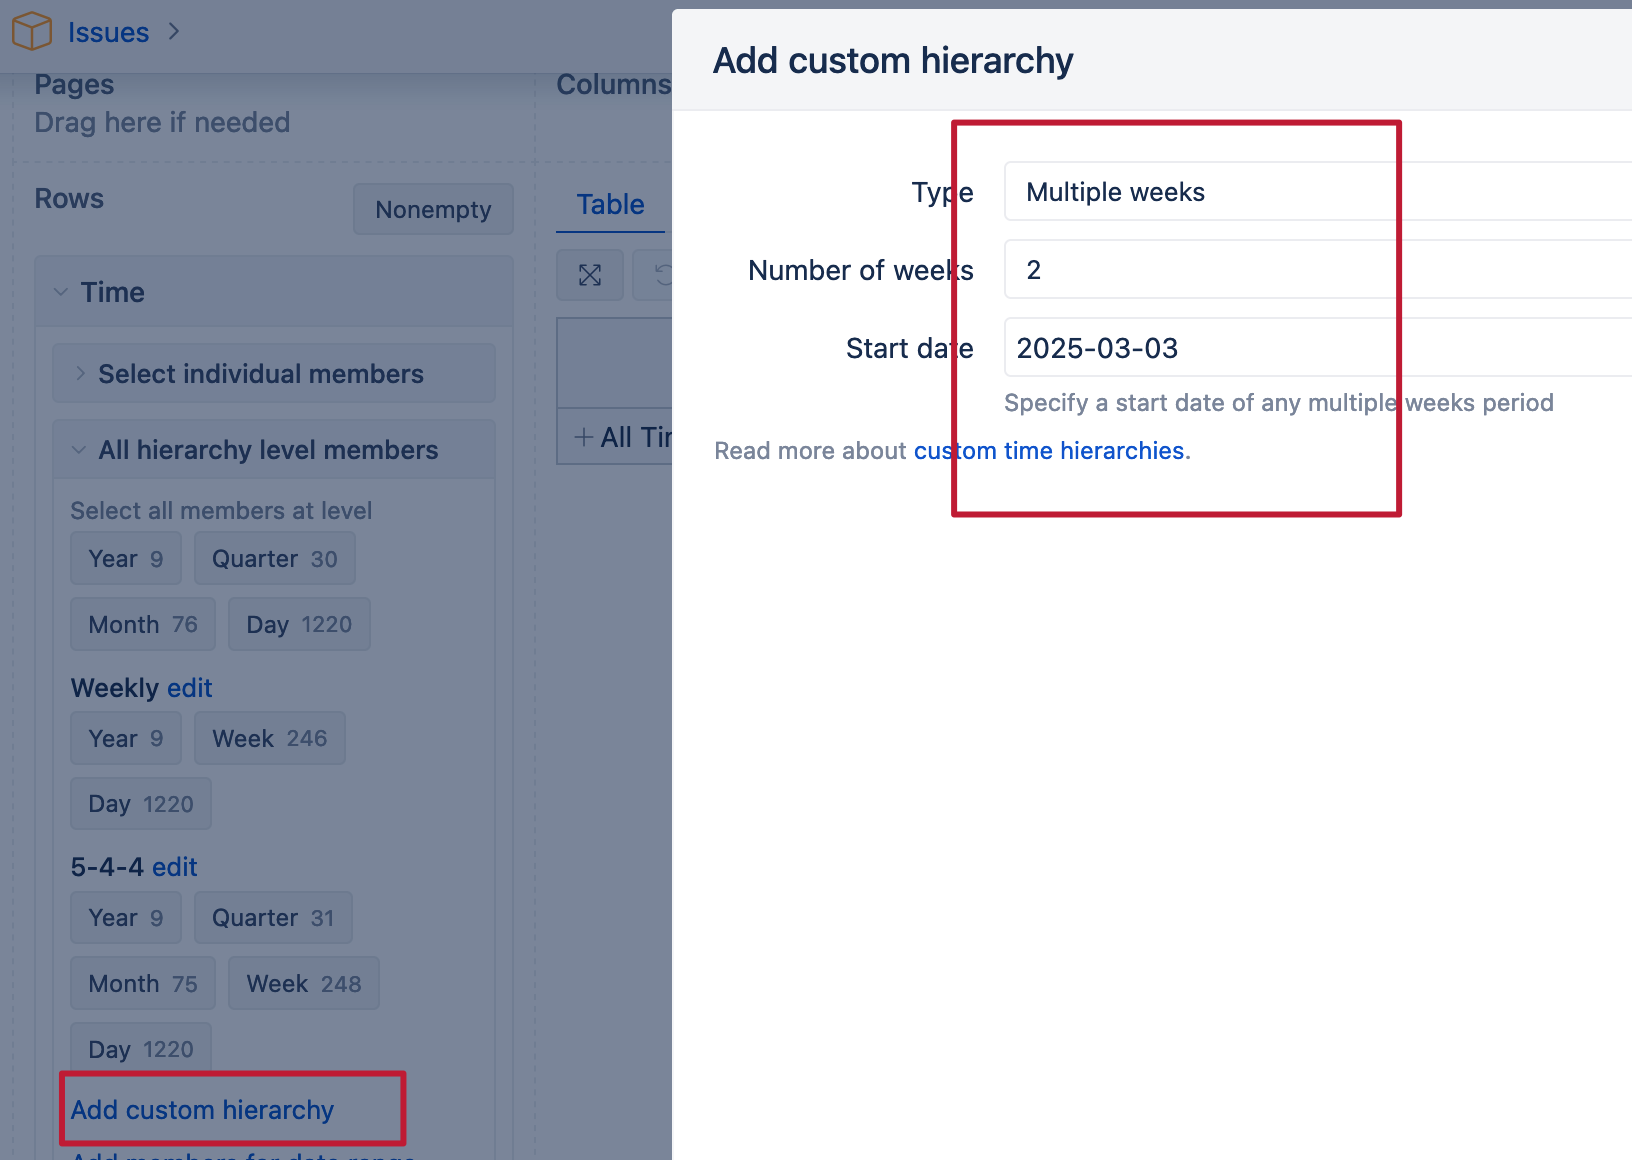
The first step is to create the new hierarchy in the Time dimension and generate future periods:
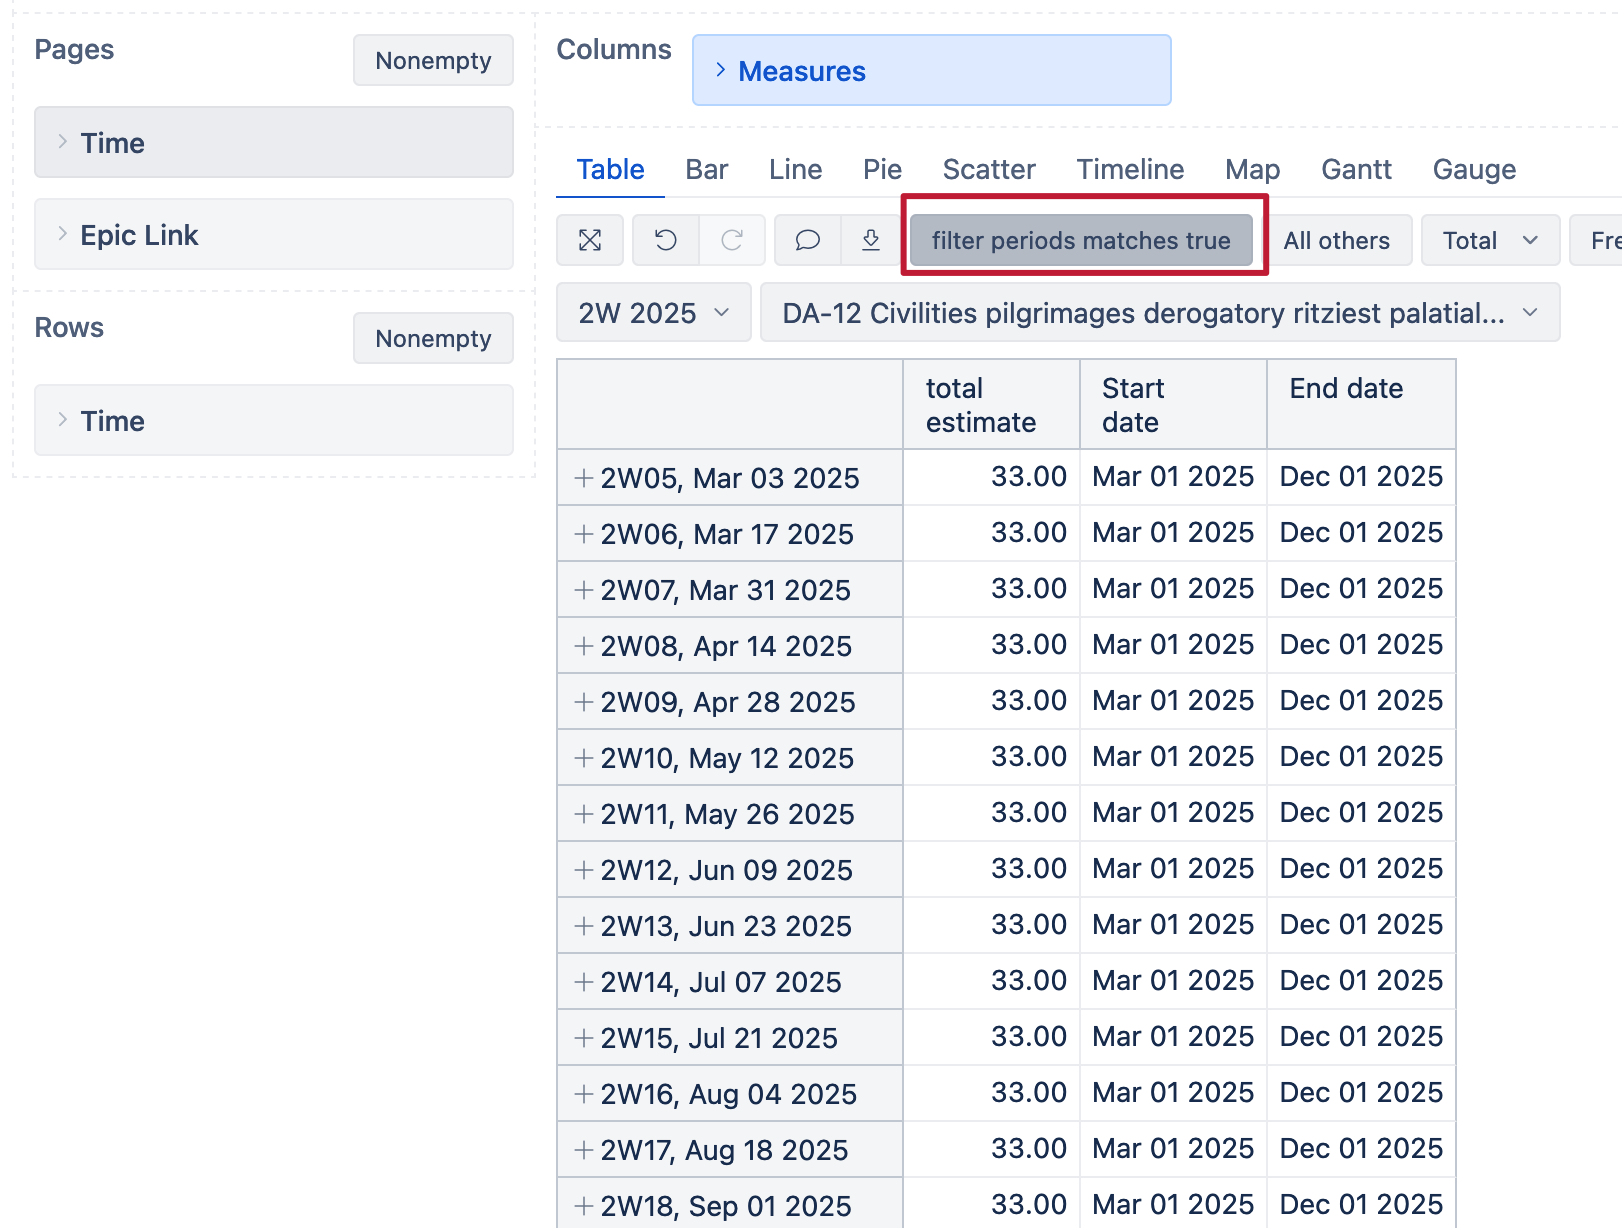
Now we can put the bi-weekly periods on the report rows and use Epic for page filter.
I created additional custom measures:
-) Start date, End date giving the dates of my burnup range
DateParse(
  '2025-03-01'
)
DateParse(
  '2025-12-01'
)
-) Total estimate
([Measures].[EPIC ROM Days created],
[Time].CurrentHierarchy.DefaultMember)
-) Measure for filtering the date ranges between start and end dates:
DateBetween(
  [Time].CurrentHierarchyMember.StartDate,
  [Measures].[Start date],
  [Measures].[End date]
)
-) Now I can create a custom formula for the burnup. There are different ways to do that. The following formula is quite universal and could work with other time dimension selection on the report rows:
[Measures].[total estimate]/

Count(VisibleRowsSet())
*
Rank(CurrentTuple(VisibleRowsSet()), VisibleRowsSet())
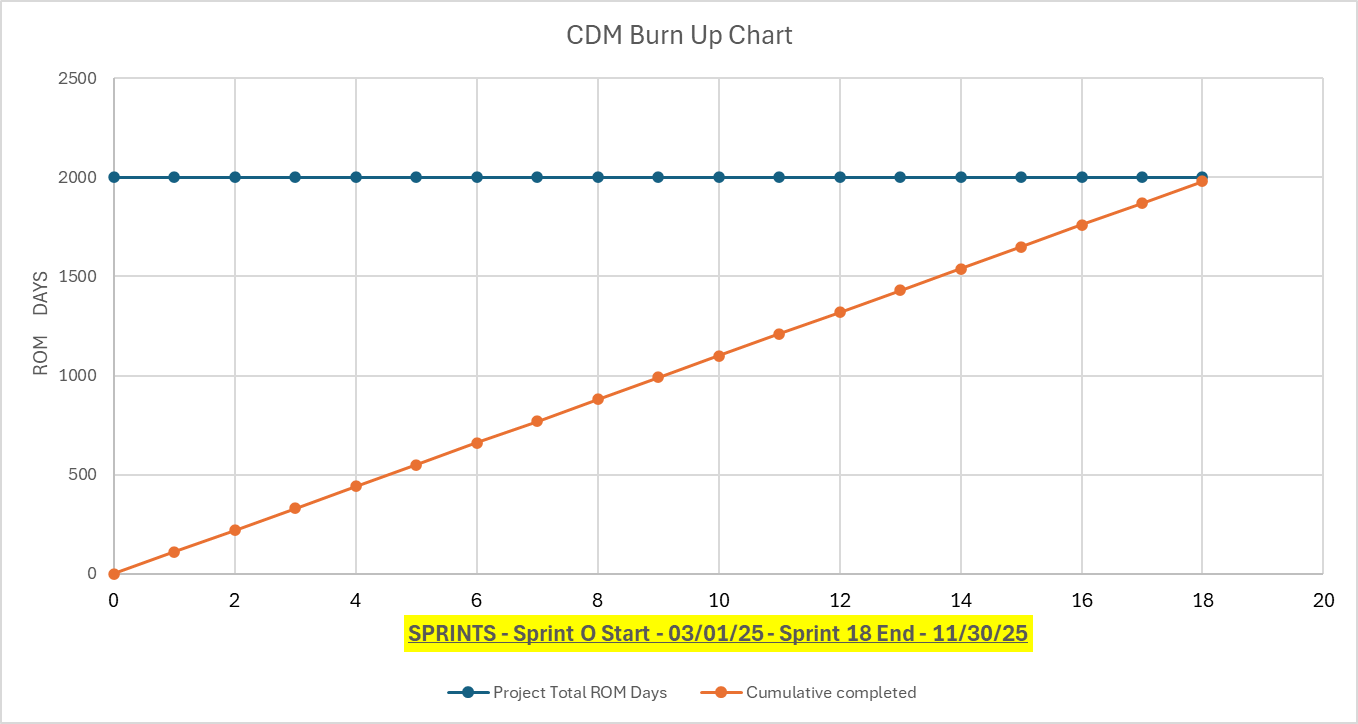
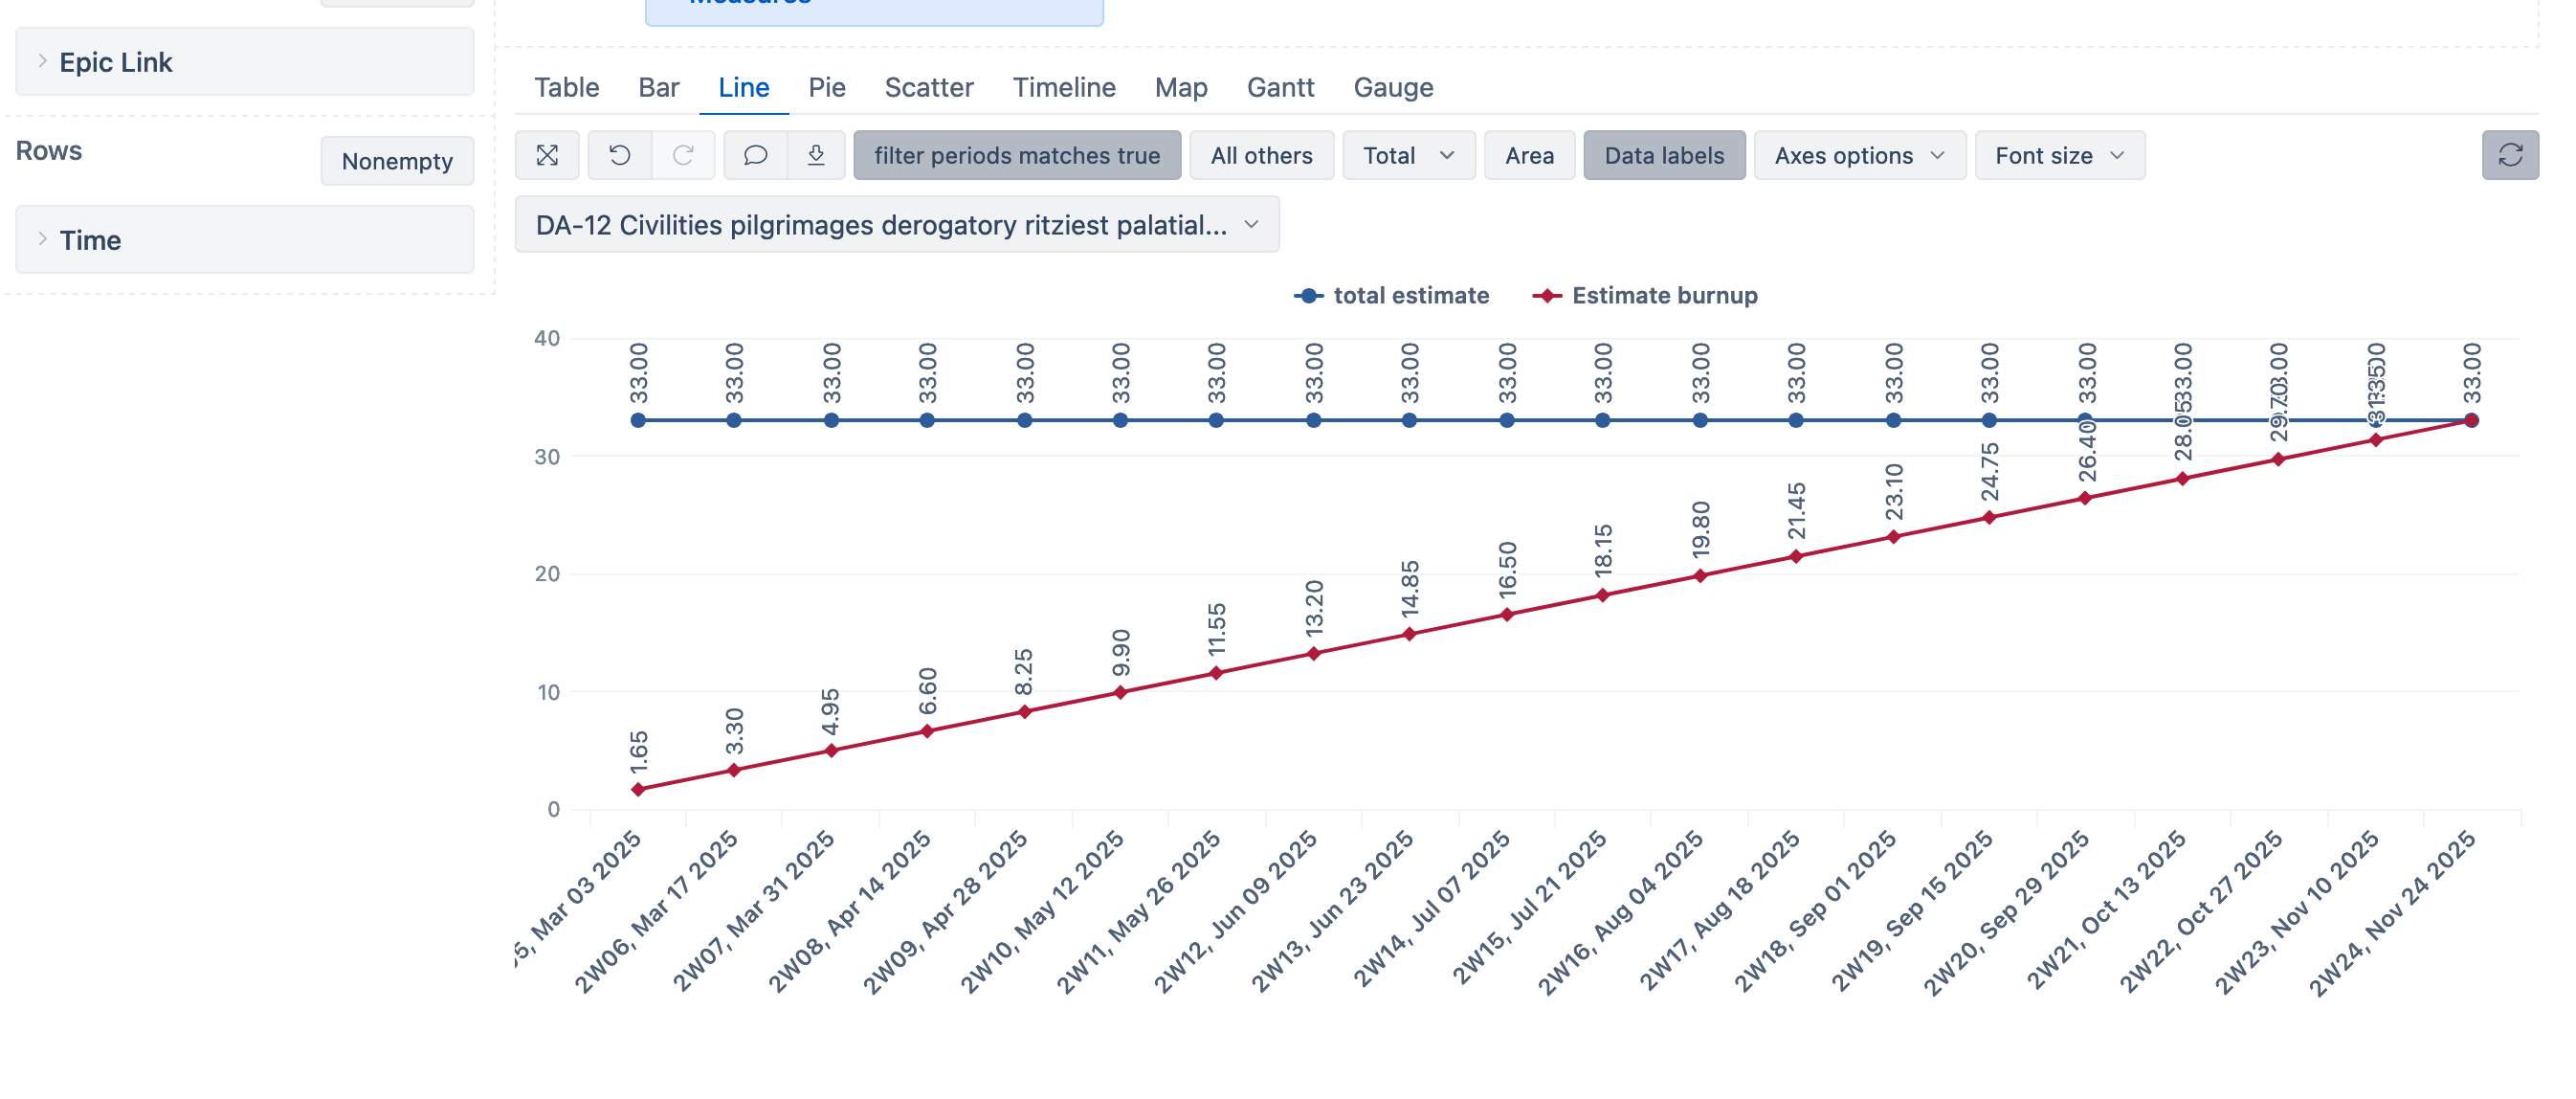
I switched the report to the line chart and now can see the epic burnup:
Kindly,
Janis, eazyBI support
Hi Janis!! I wow!! Thank you very much!! I just followed your steps! replicated the same with the data that we are looking for. Awesome job by EazyBI support team!!
Hi Janis,
From the picture above - Red line that starts at 1.65 and burn up towards 33. How do I show as a start of 0,1.65,3.30 burn up to 33?
This is the formula I am using and I like to from 0 towards burn up. Please help.
[Measures].[CDM Total Estimate]/
Count(VisibleRowsSet())
*
Rank(CurrentTuple(VisibleRowsSet()), VisibleRowsSet())
Hi,
Current solution shows the linear burn-up that should be reached at the end of each period, which is the reason why it shows 1.65 at the end of first week.
The following formula can be used if you want to play with the initial burndown level:
[Measures].[total estimate]
/
Count(VisibleRowsSet())
*
Rank(CurrentTuple(VisibleRowsSet()), VisibleRowsSet())
+
(1.65 - 1.65  -- change here adjusted initial burndown level
/
Count(VisibleRowsSet())
*
Rank(CurrentTuple(VisibleRowsSet()), VisibleRowsSet())
)
Kindly,
Janis, eazyBI support
Hi Janis,
I copied your formula but maybe I am not understanding “Initial burndown level” . Here is the table I got which is what shown as burn up chart.
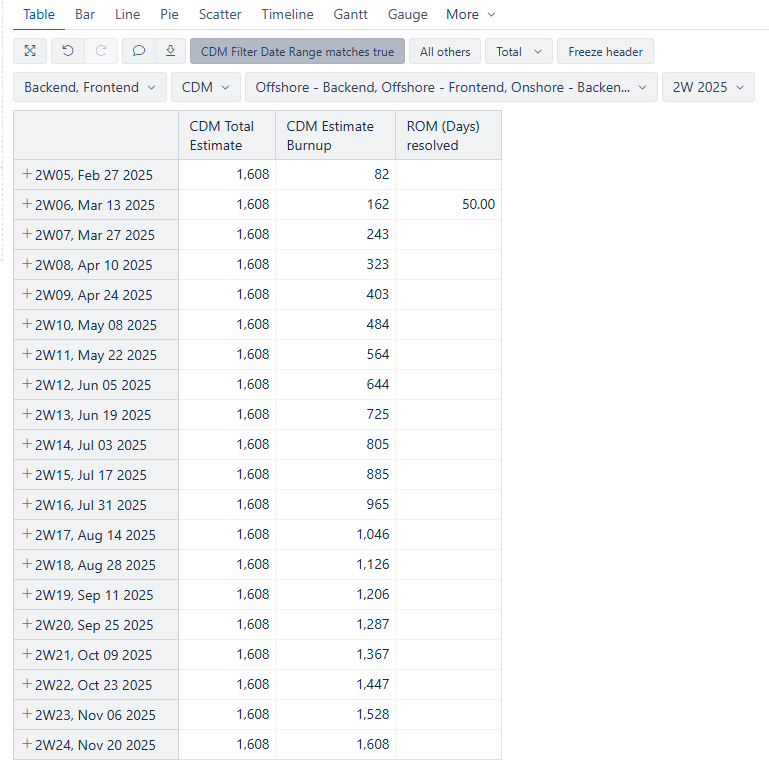
On row1 Feb 27 2025 I want to show as 0 and for the rest of the visibilerowset I like to continue with the formula matching 1638 by Nov 20 2025
[Measures].[total estimate]
/
Count(VisibleRowsSet())
*
Rank(CurrentTuple(VisibleRowsSet()), VisibleRowsSet())
+
(1.65 - 1.65 – change here adjusted initial burndown level
/
Count(VisibleRowsSet())
*
Rank(CurrentTuple(VisibleRowsSet()), VisibleRowsSet())
)
Can you please help me with change adjust initial burndown ?
Also,
ROM (Days) Resolved column - I would like to show 0 on first row and leave blank for the rest of the column. So, it will be 0,50 and all the other rows are blank to show that actual Rom Days resolved so far.
Thank you in advance.