Dear all,
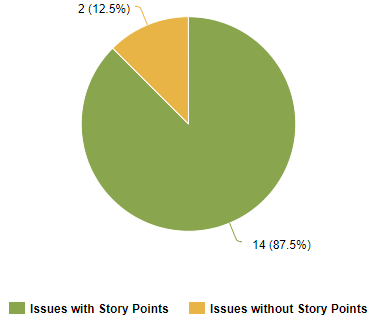
I use a simple graph to show the Number of Estimated vs Unestimated Items.
Considering just the field Story Points that works fine:
I am using these measures:
- With Story Points is easy, just “[Measures].[Issues with Story Points created]”
- Without Story Points is:
CASE WHEN [Measures].[Issues Created] > 0 AND
NOT [Measures].[Issues created] =
[Measures].[Issues with Story Points]
THEN
[Measures].[Issues created] -
[Measures].[Issues with Story Points]
END
Now I want to consider a second field (Custom Field called “Effort Size”). So I try to create two new calculated measures:
- Estimated = Non Empty Story Points OR Non Empty Effort Size
- Not Estimated = Empty Story Points AND Empty Effort Size
What would the best way to implement them?
I was triyng some Count and Filter Functions, but I could not get it to work : /
Big thank you in advance.
BR,
Markus

