Hello,
Need Help in creating Dashboard in EazyBI By importing Excel Data.
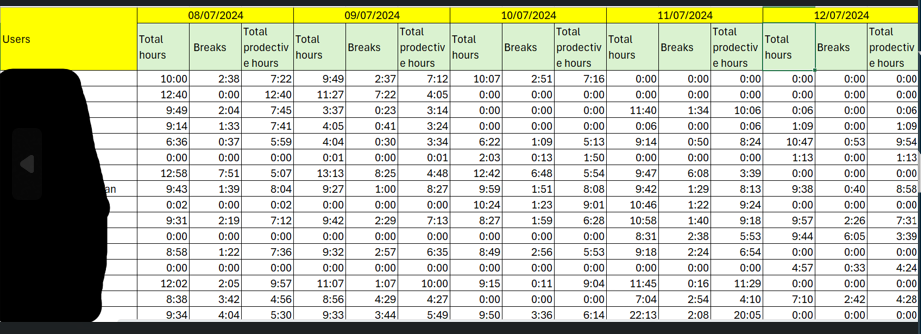
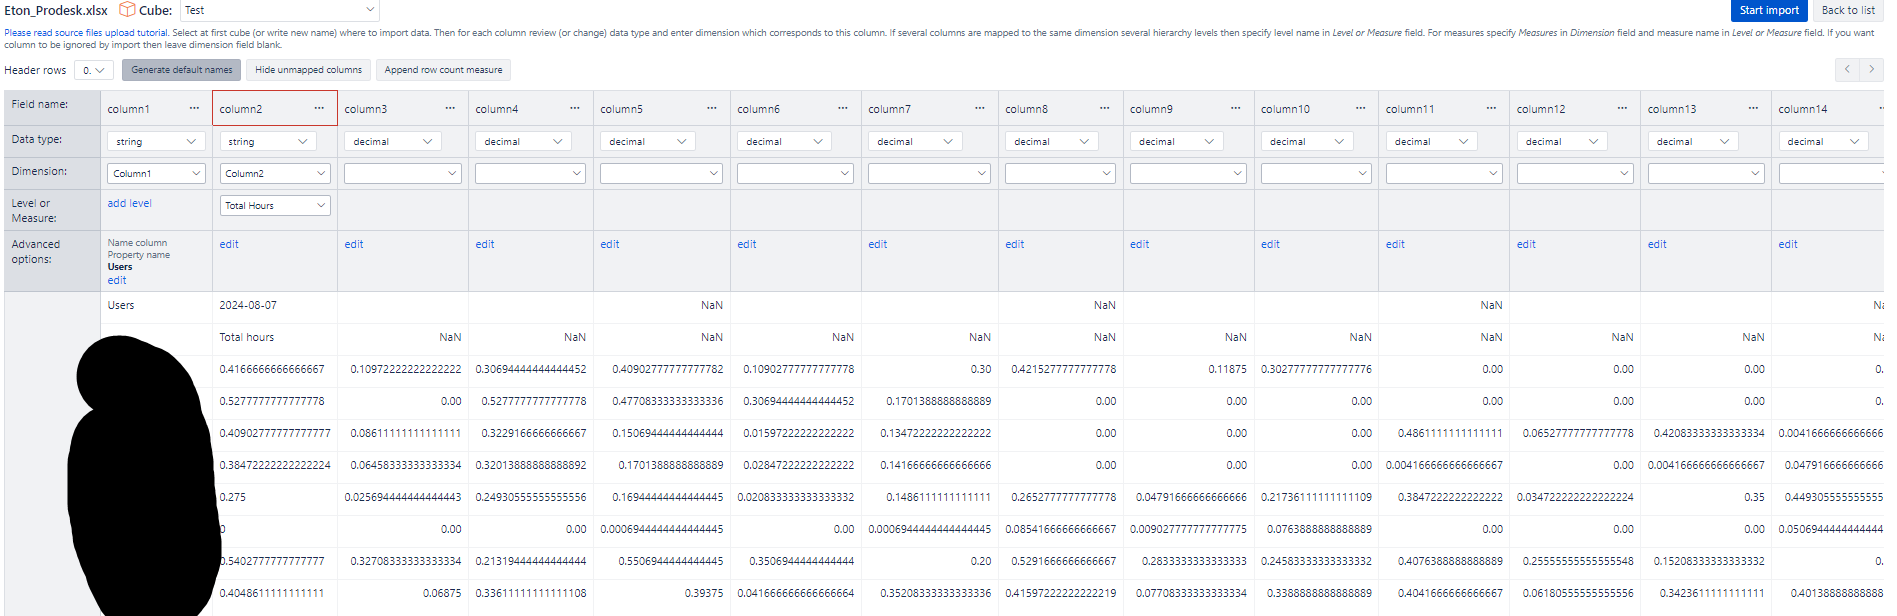
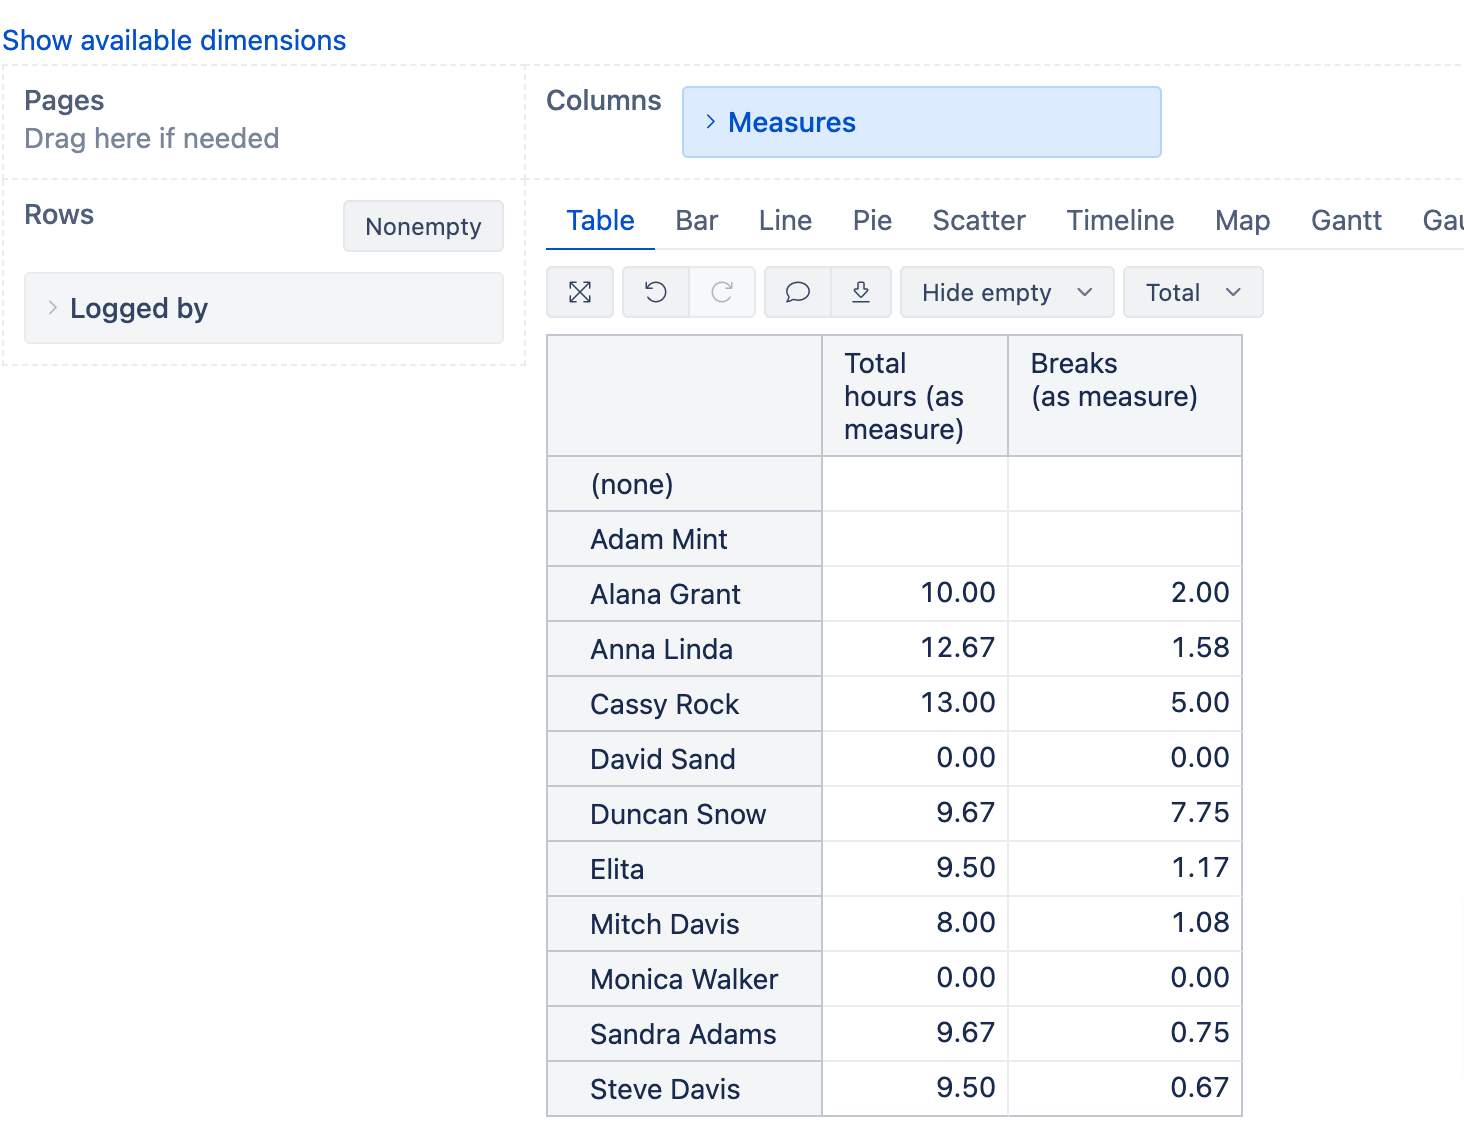
So I need to create a dashboard where it shows users total hours worked, breaks taken and productive hours. this I have formatted in excel and uploaded in EazyBI using source data. but after importing values are not matching with Excel. Below attached screenshot for your reference
Thanks for posting your question!
Since you contacted us directly regarding this, I have responded to you directly.
I’ll add a few notes here in case other eazyBI users have similar questions.
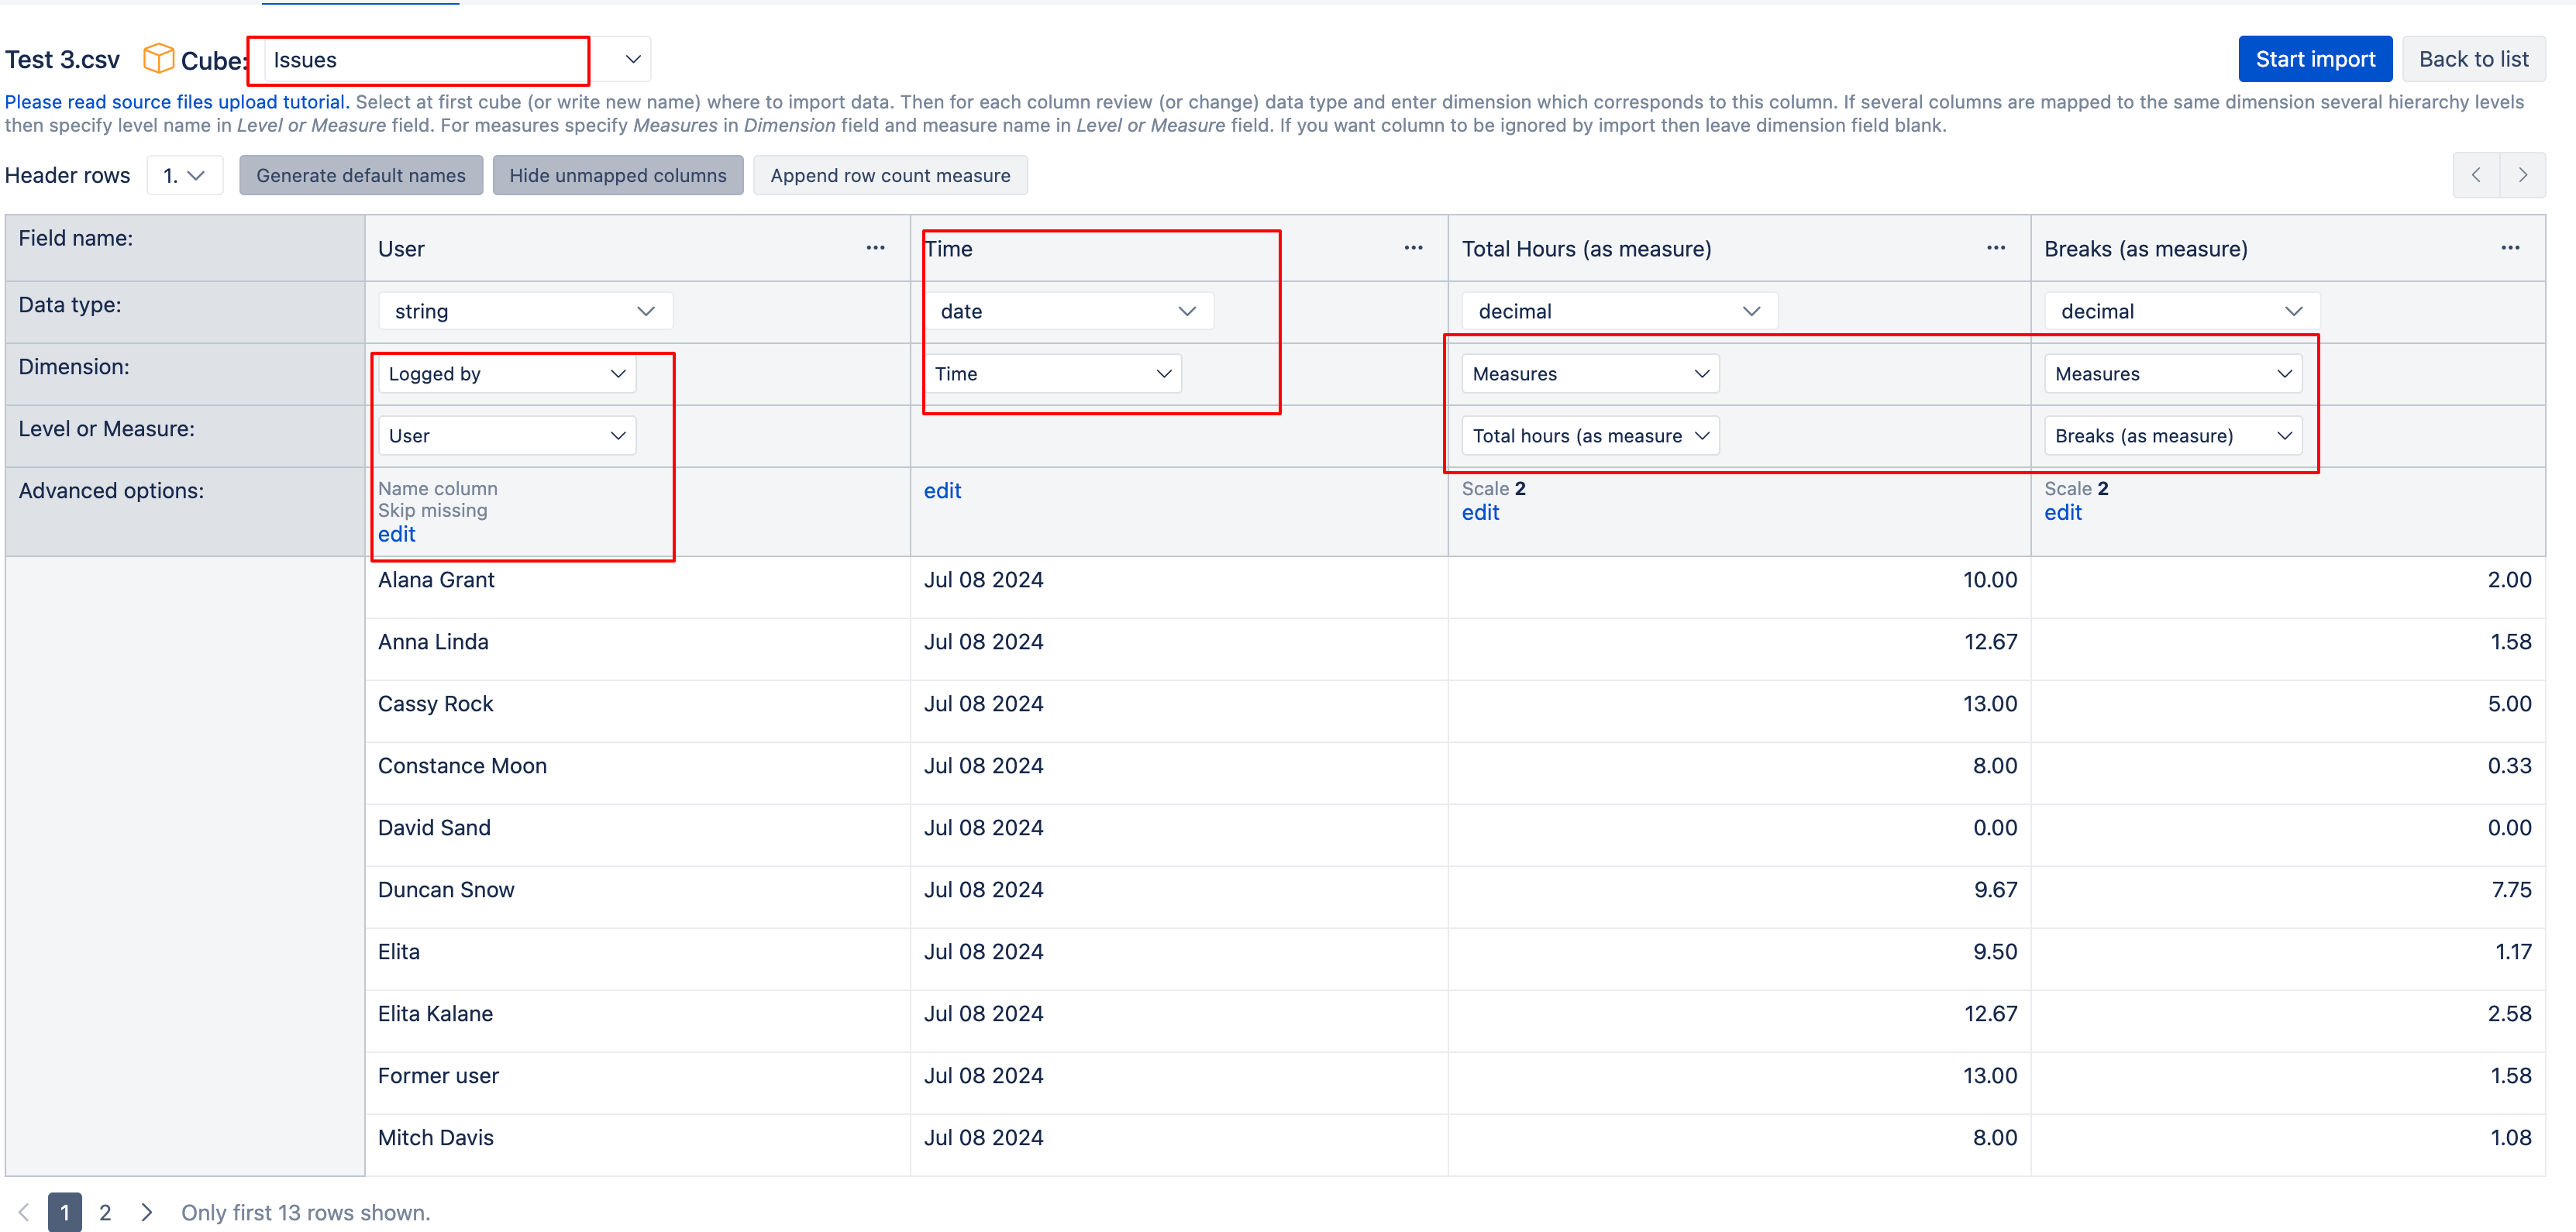
It is best to reformat the source file in a way that Time is registered in Rows, otherwise, it would be quite difficult to map the data.
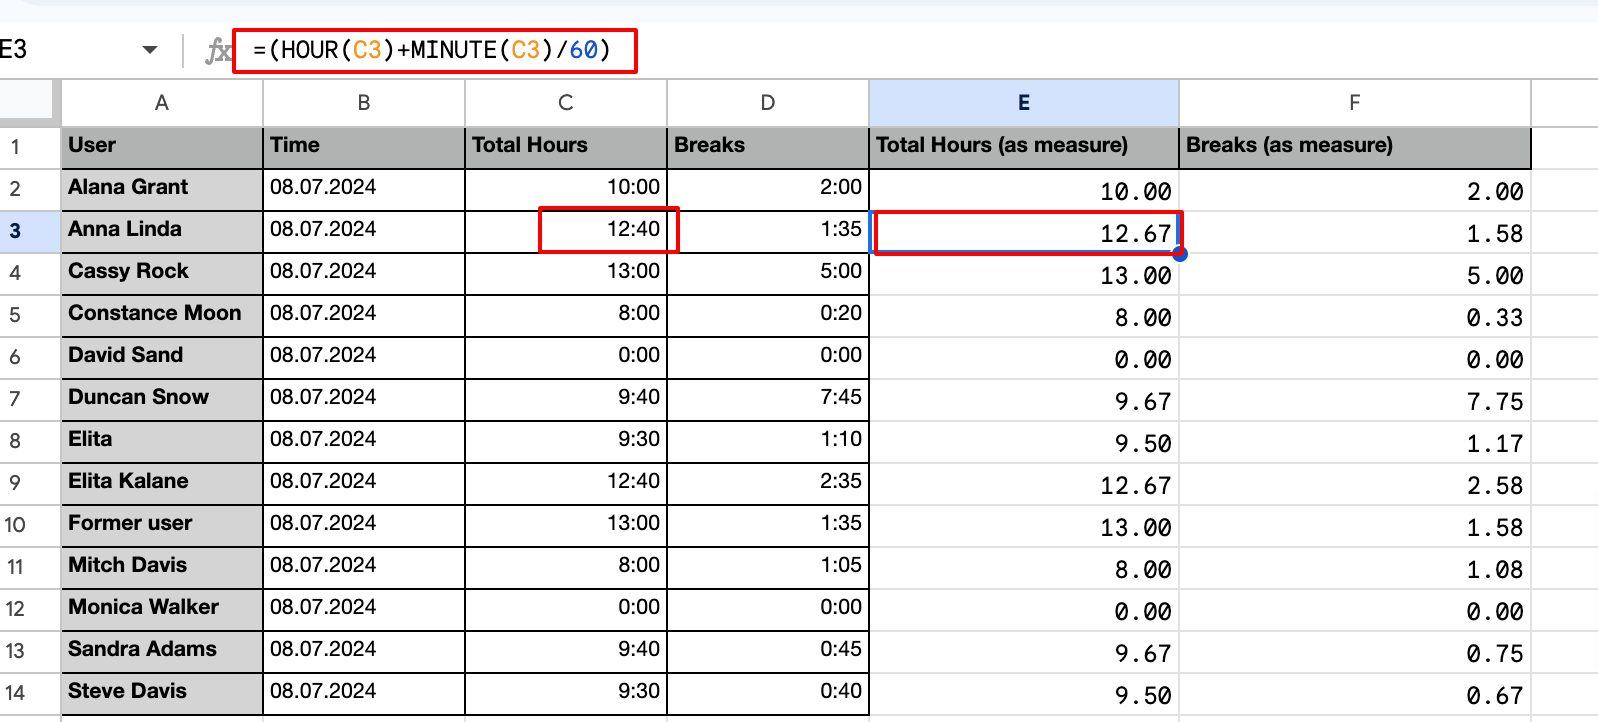
In the screenshot of the sourcefile, the time is registered as string, such as 1:30, which is supposed to be 1 hour and 30 minutes. For eazyBI to be able to calculate, aggregate, and interact with the Time dimension, the time should be registered as decimals - in this case, 1.5 (where 0.5 is a fraction of the hour). There is no need to rewrite the whole excel sheet, there is are functions in excel that can help with reformatting the registered time “=(HOUR(**C2** )+MINUTE(**C2** )/60)” replacing the C2 with the cell where the value is.
Potentially this is how the source file could look:
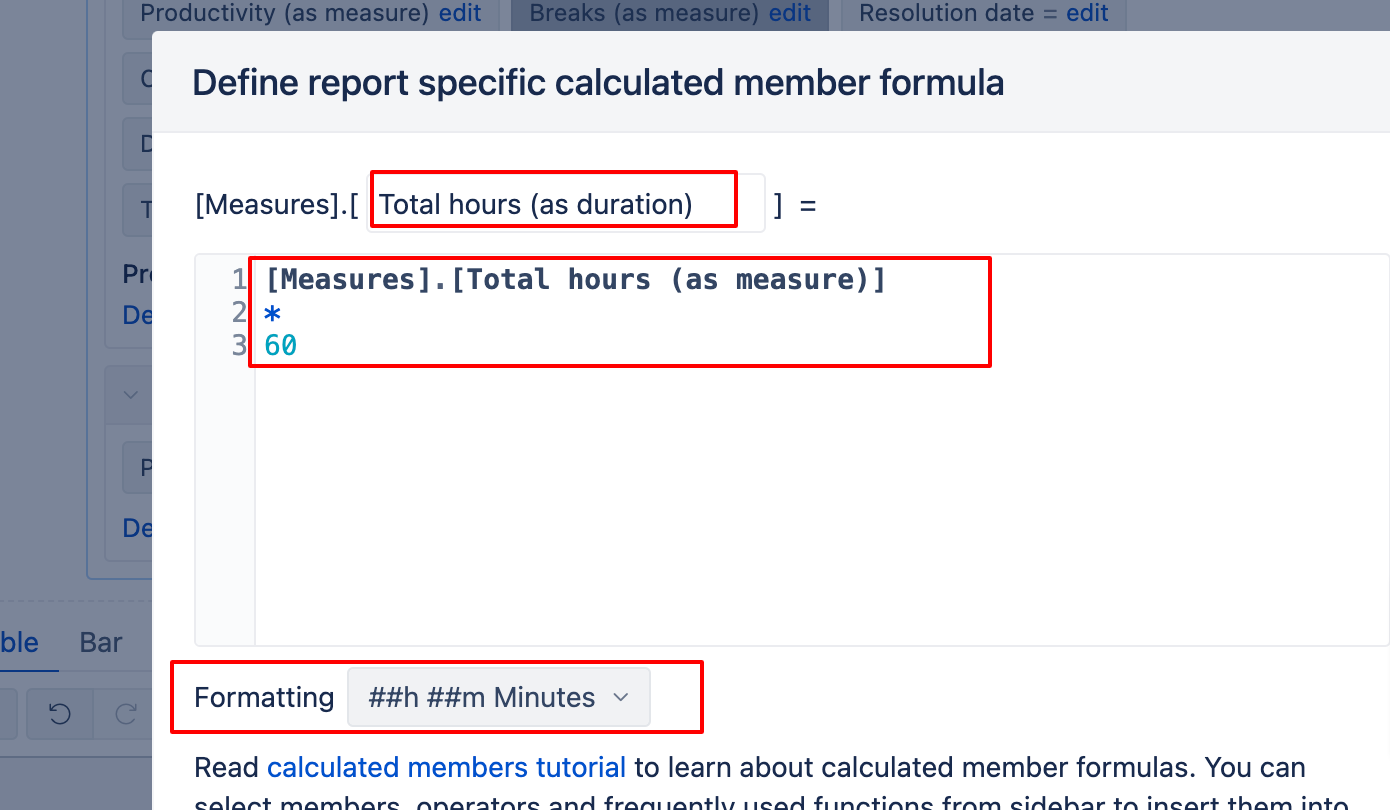
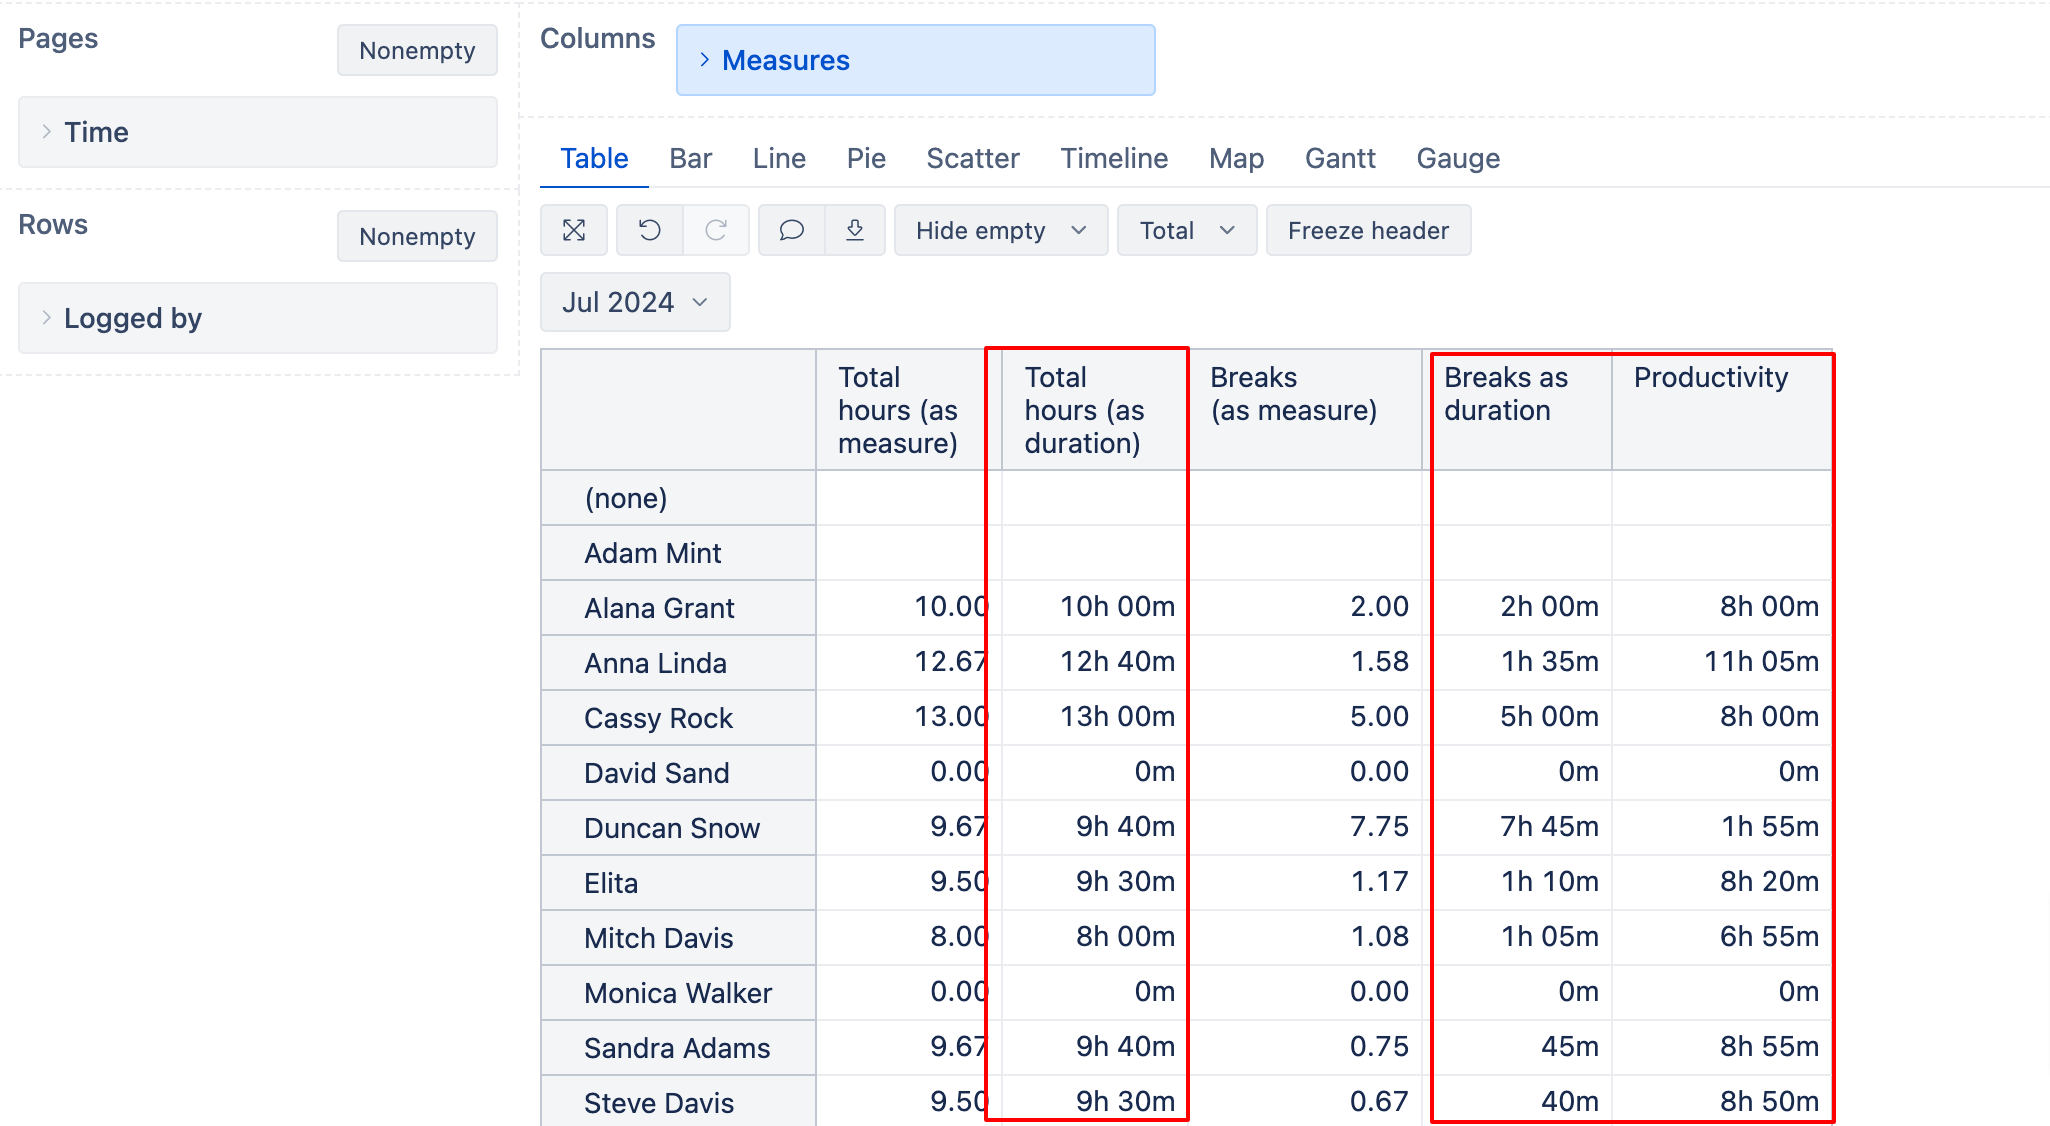
To transform the Total hours and Breaks into duration, you should create two calculated measures where you multiply each existing measure by 60 and choose formatting “Duration” → Hours, minutes. Similarly like ive done in the screenshot below.
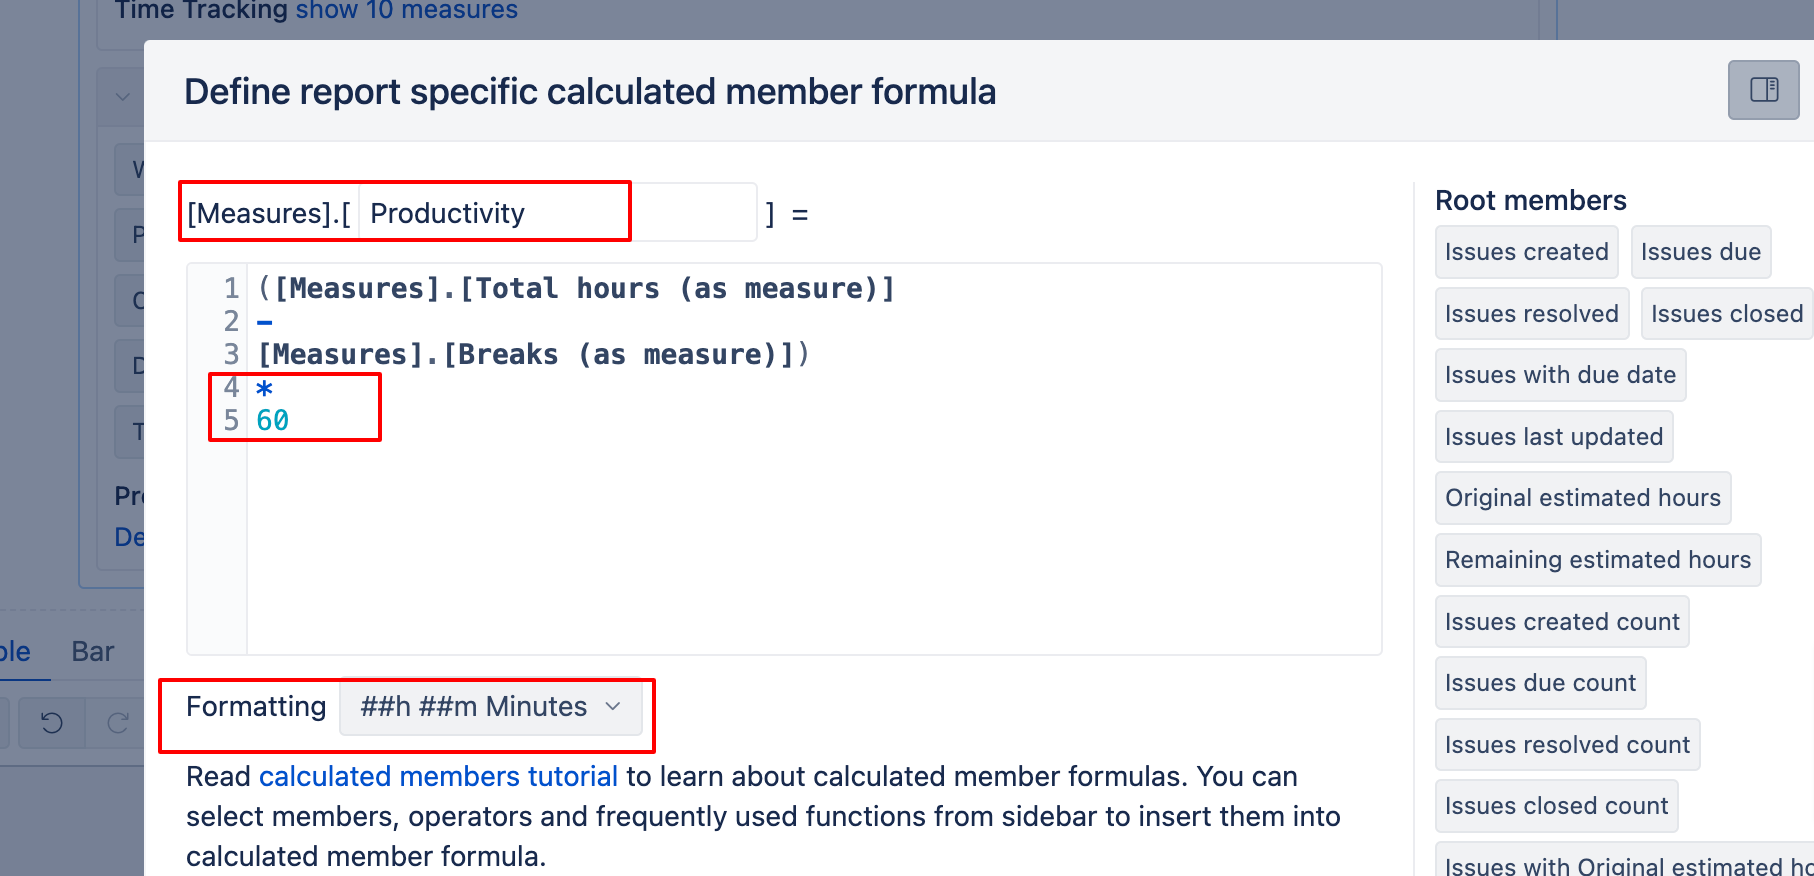
To calculate the productivity, you will need to define a new calculated measure to subtract the breaks from total hours, and again - multiply the formula by 60 to convert the spent time into minutes so you can parse the value as duration
Thanks! this works but I am not able to add time filter in dashboard, so that I can choose specific date to view the data can you help how can I do that.?
Thanks for following up and confirming it works (somewhat )
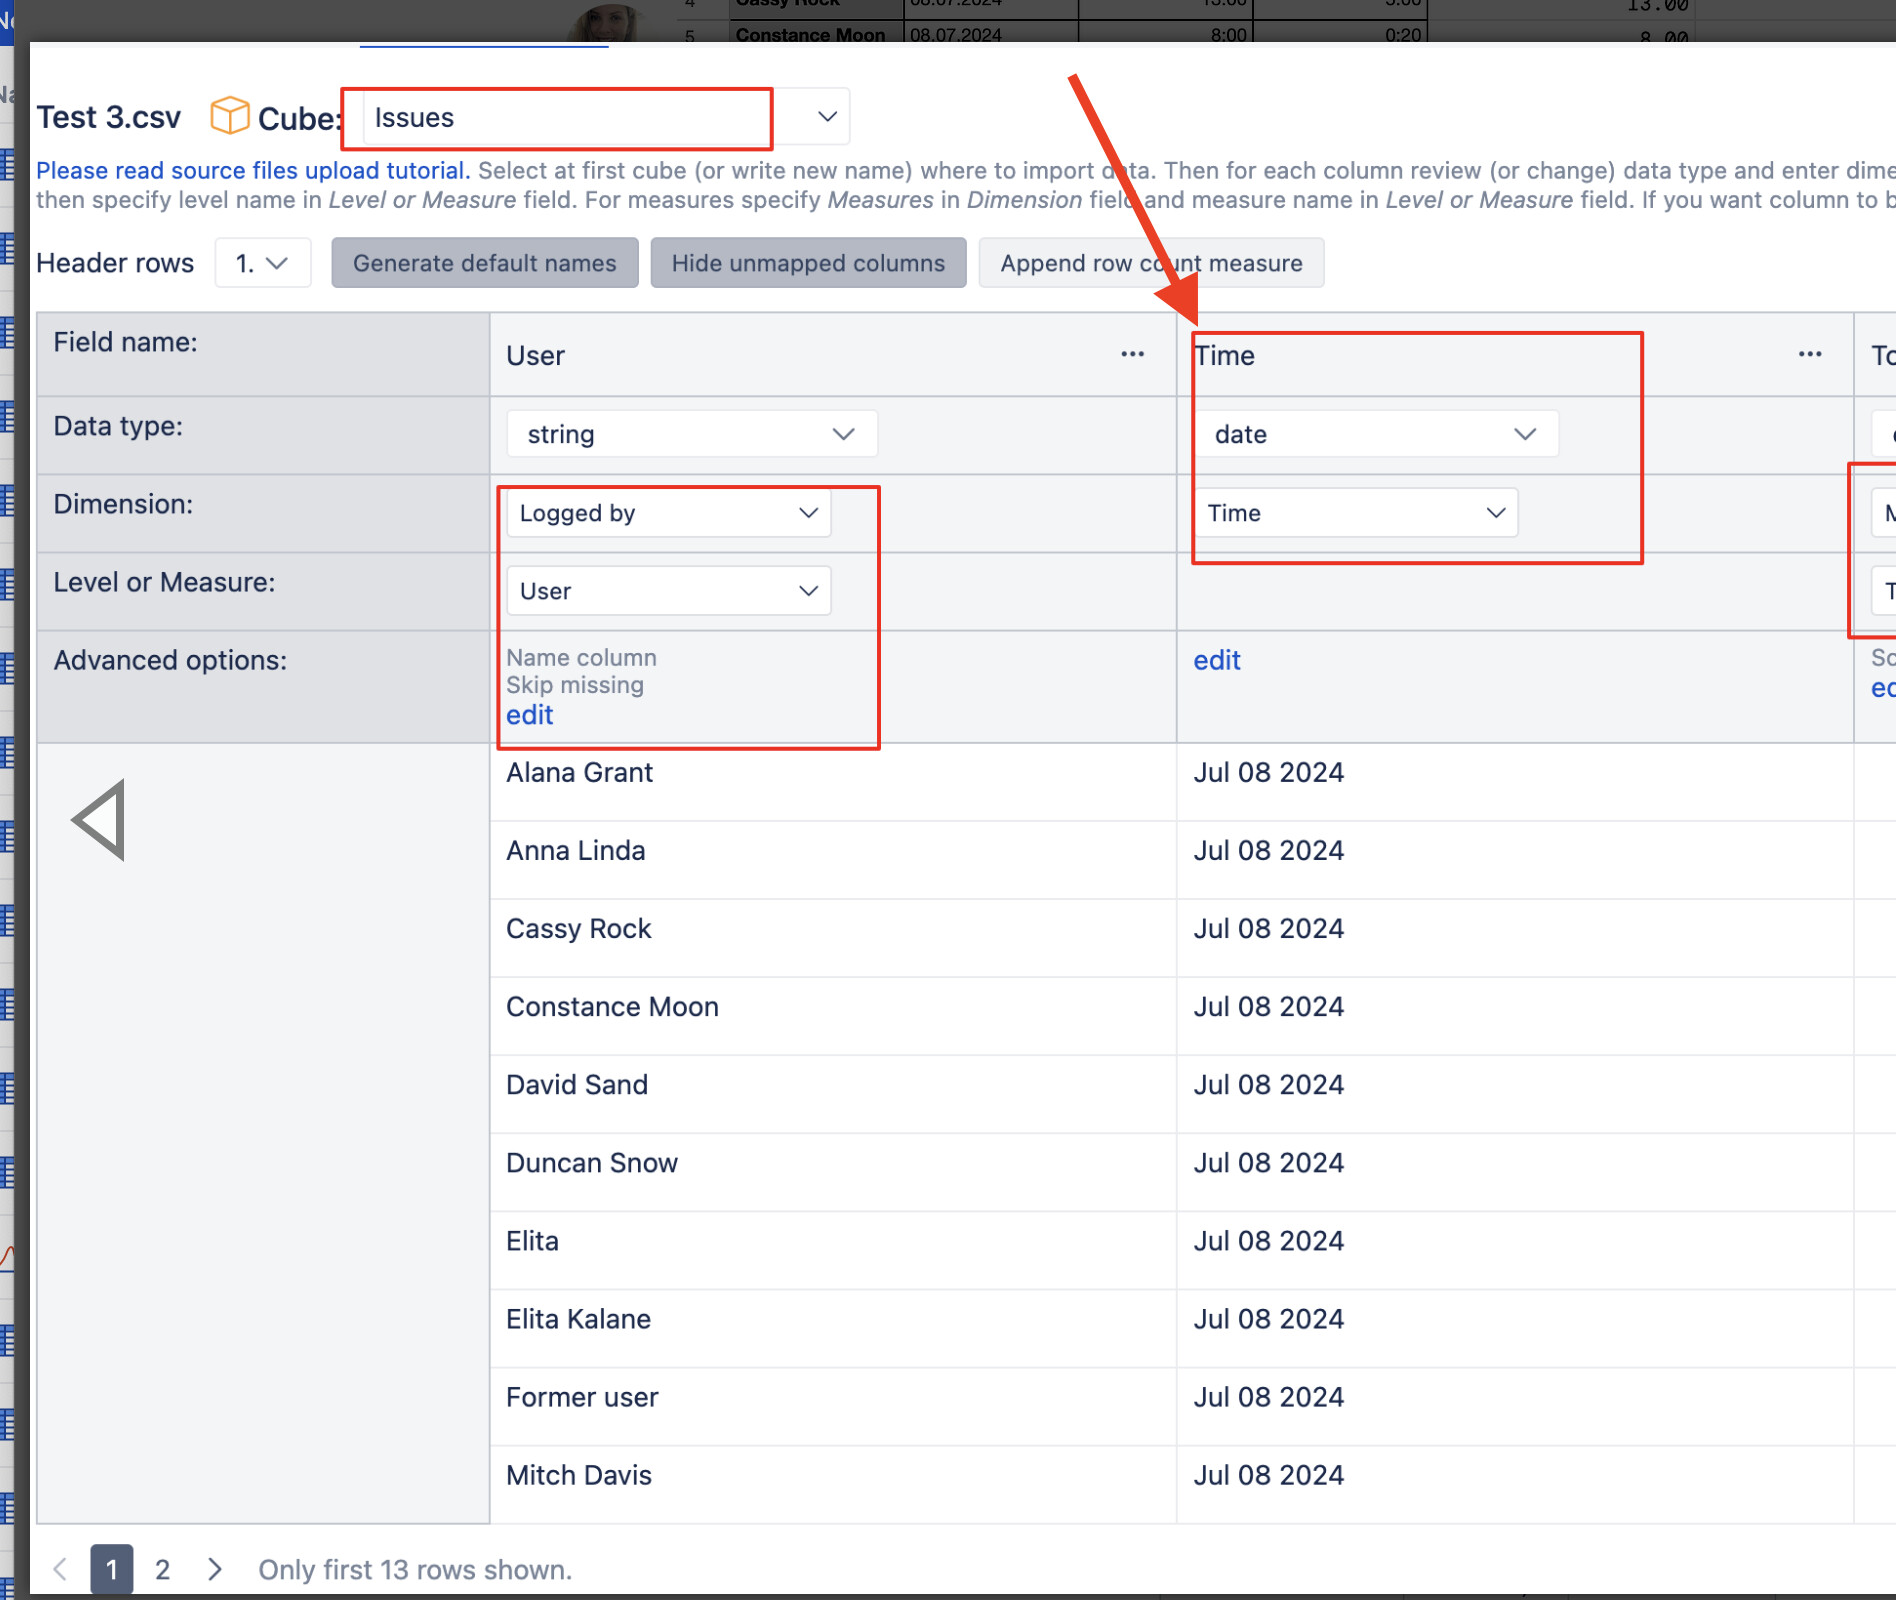
The time filter should work if you map it to the Time dimension similarly as in the mapping screenshot I shared.
For me to understand why it is not working for you I would need to see your data mapping screenshot. If you don’t feel comfortable sharing it here in the Community Page, you can reach out to us directly at support@eazybi.com