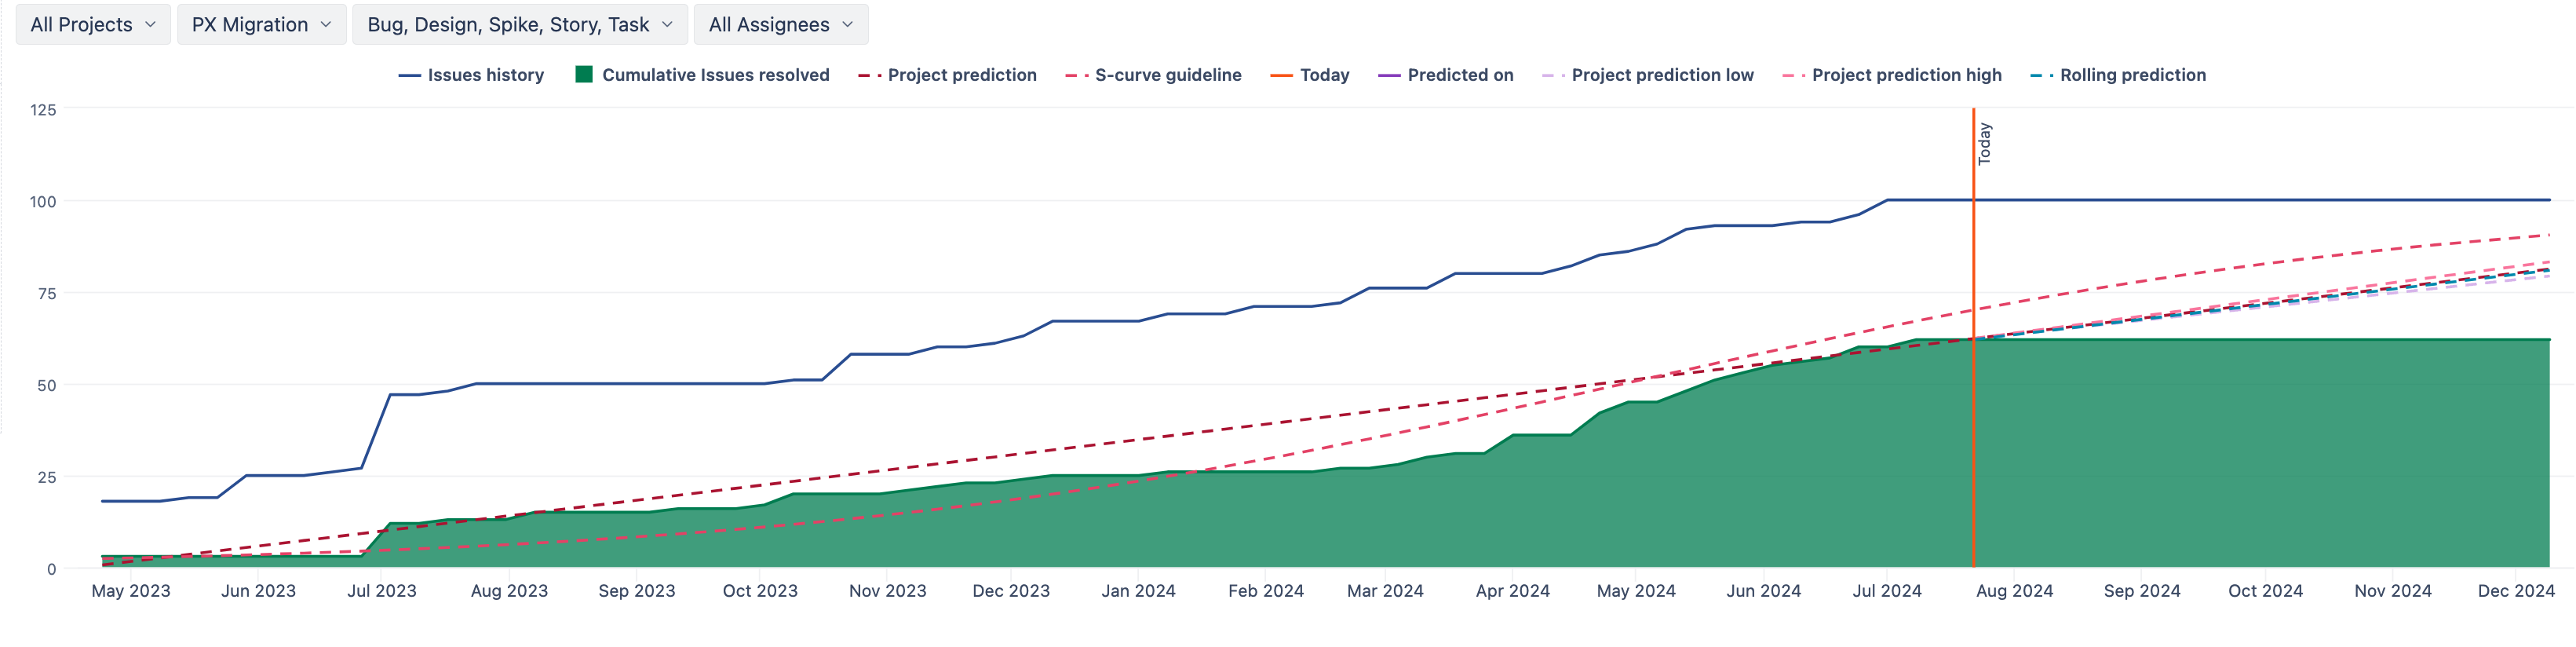
Hello, I’m using the project prediction report template to predict the completion date for a project.
As you can see at the moment, the forecast goes beyond the dates the chart is showing. How can i extend the dates further into 2025.
Also, is there a way I could change the forecast line so they are based off the average for the last few months (for example) as opposed to the whole time this was being worked on?
If you would like to see data for future time periods, you can add time members for a specified date range in the Time dimension: Time dimension
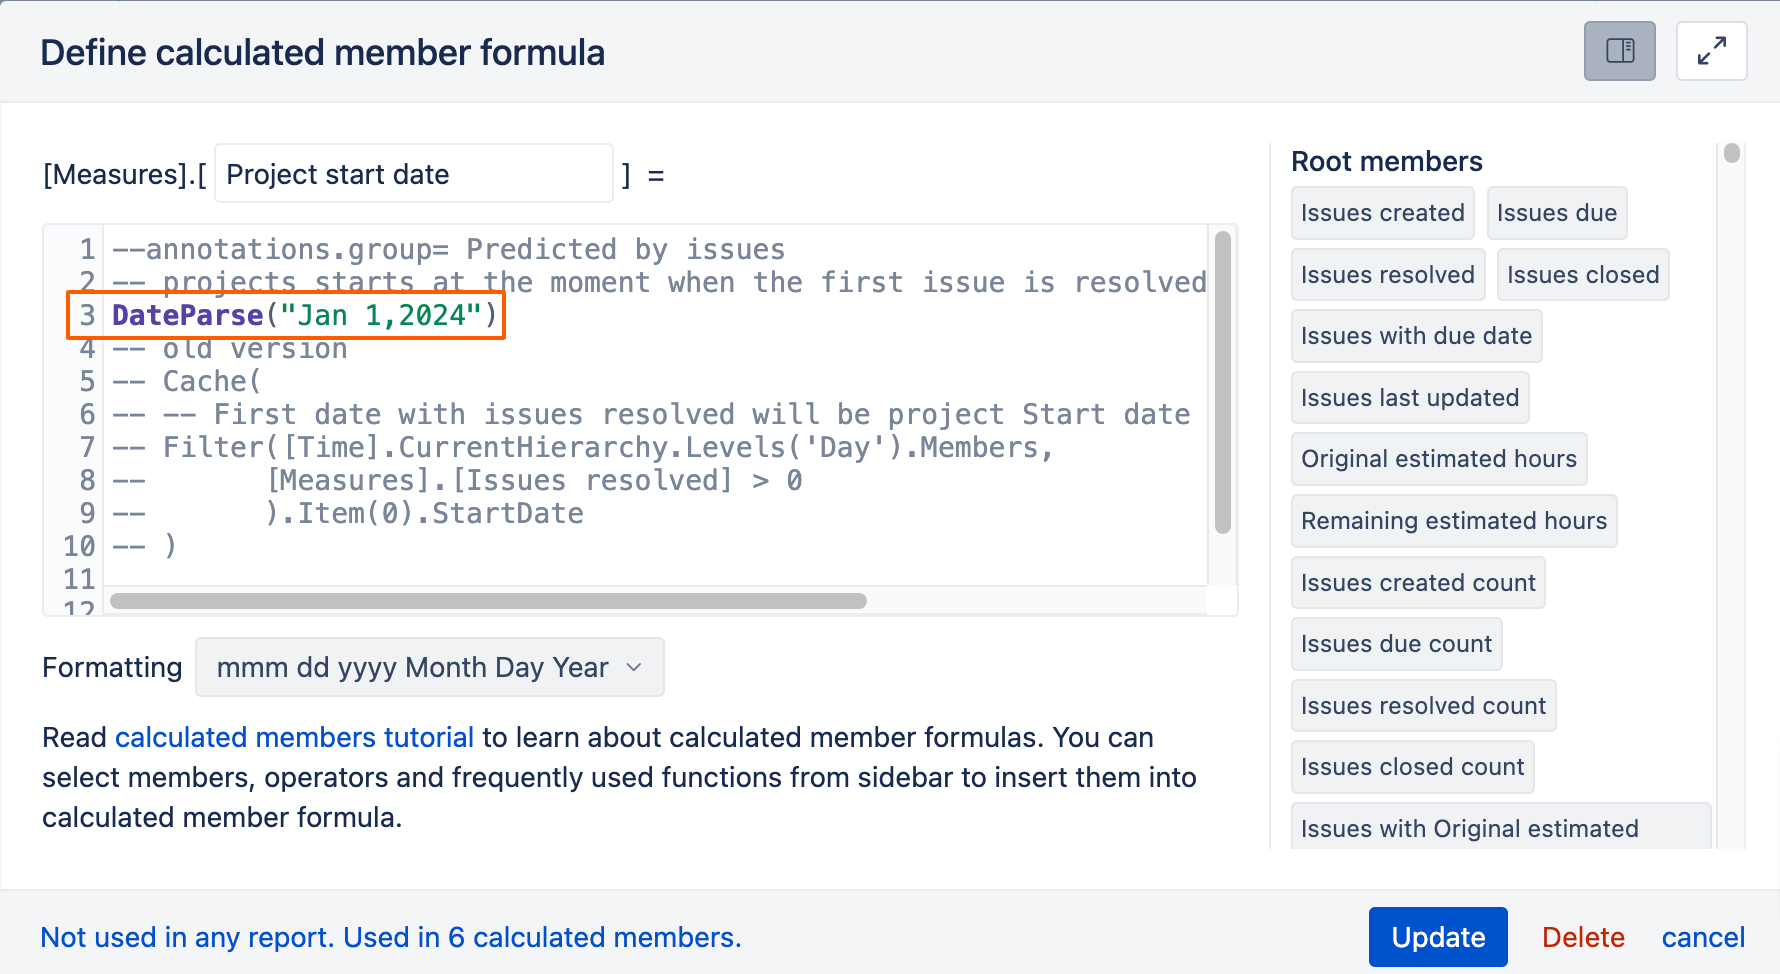
As for the second question: yes, but you need to update the “Project start date” measure with the necessary date as this is the measure that “Project prediction” takes into account when generating the report.
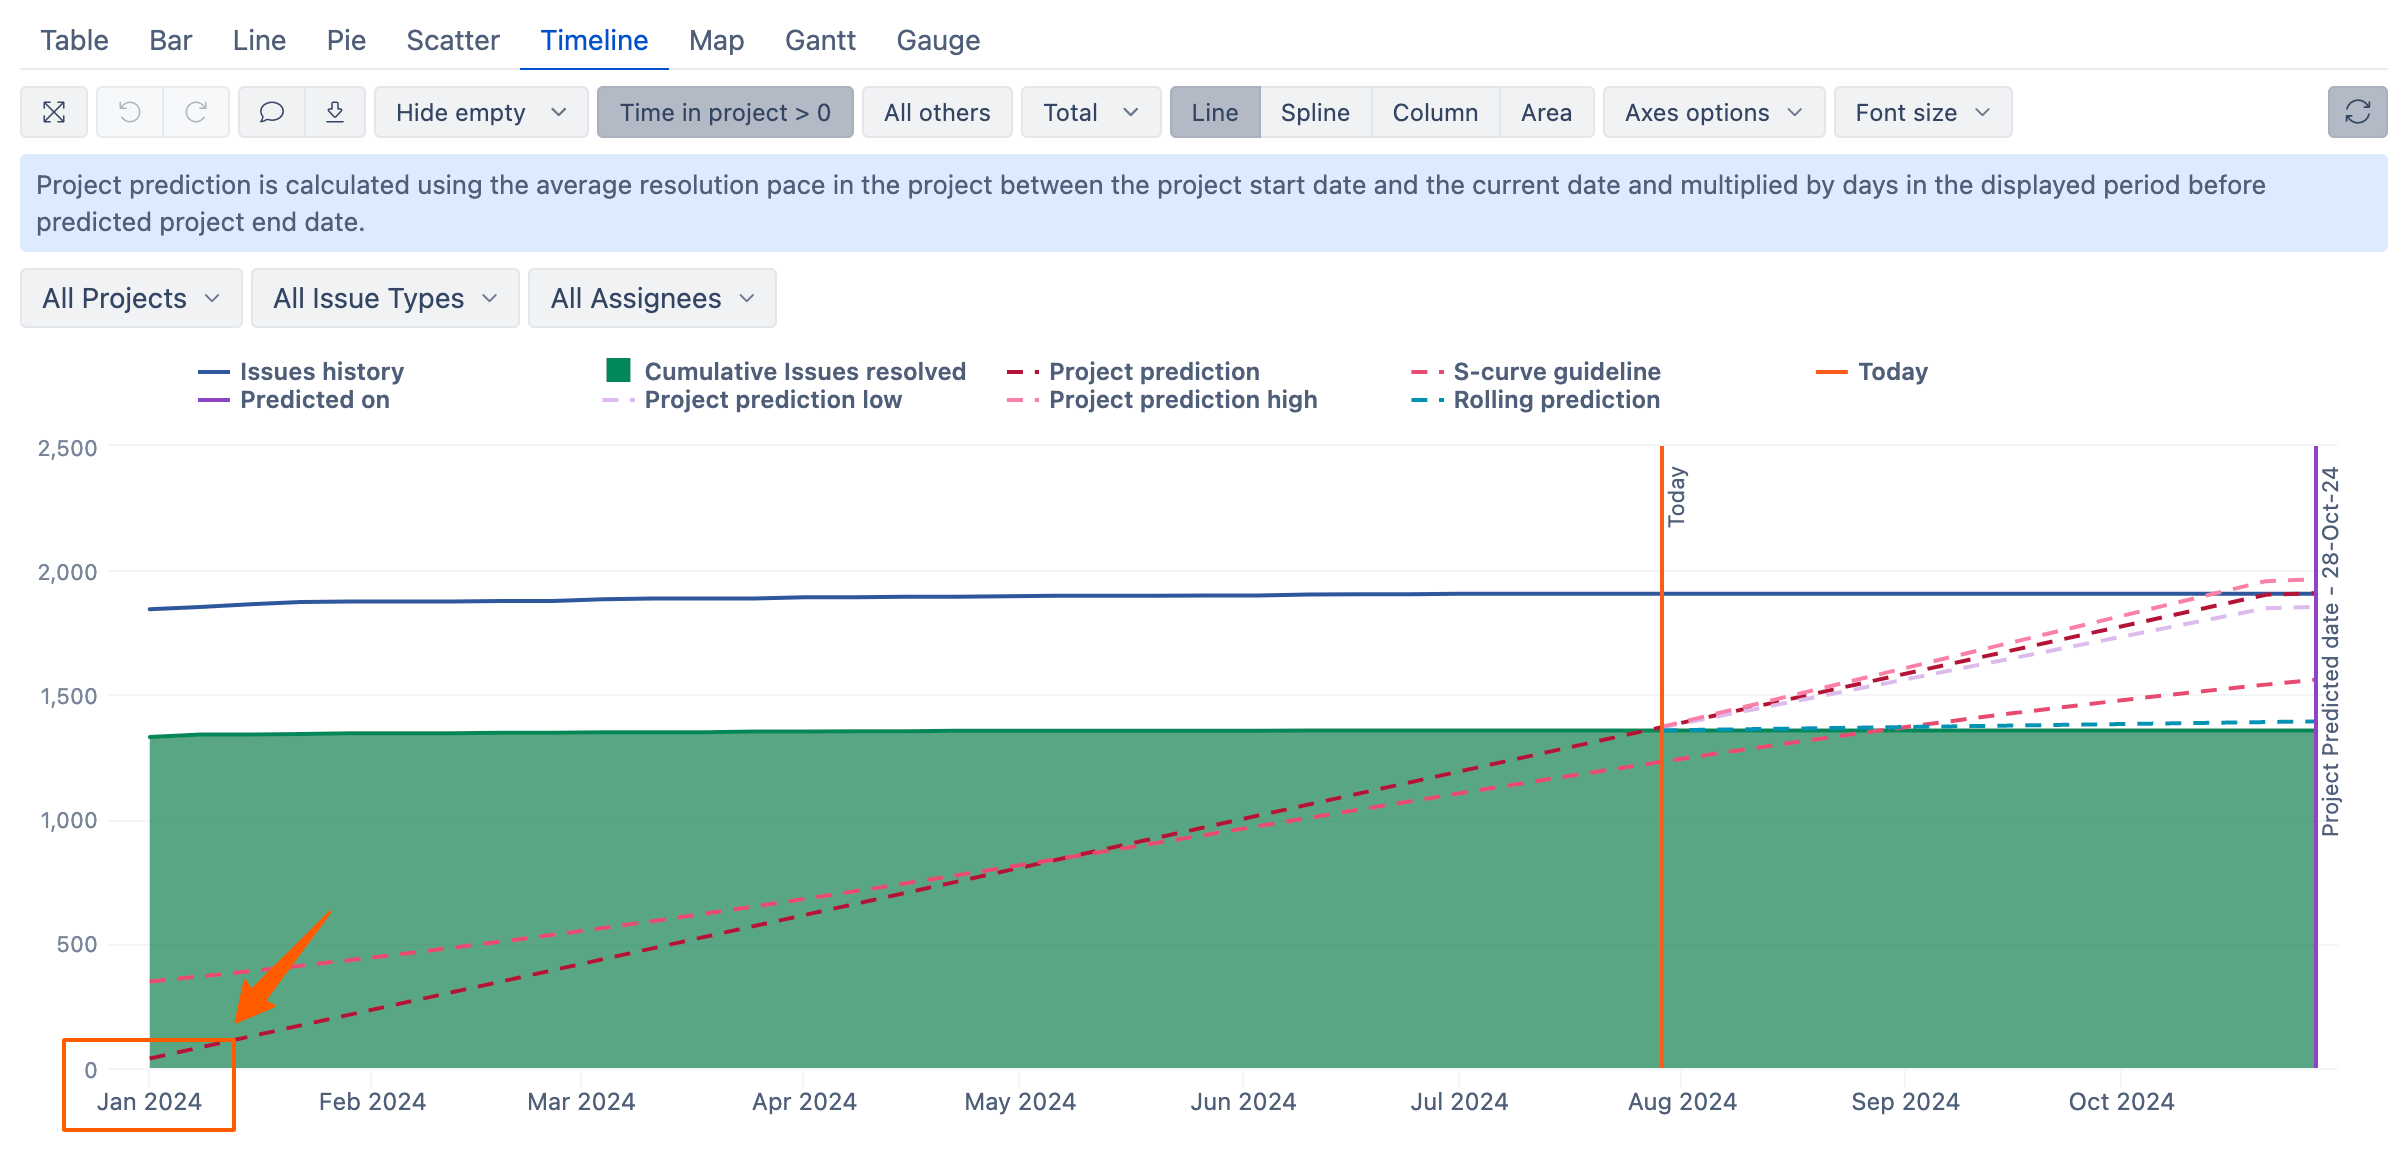
In my example below, I am changing it to the 1st of January 2024.
Once you refresh the report, measure “Project prediction” will consider Project as started on the 1st of Jan 2024 and will show the prediction from there.