Hello,
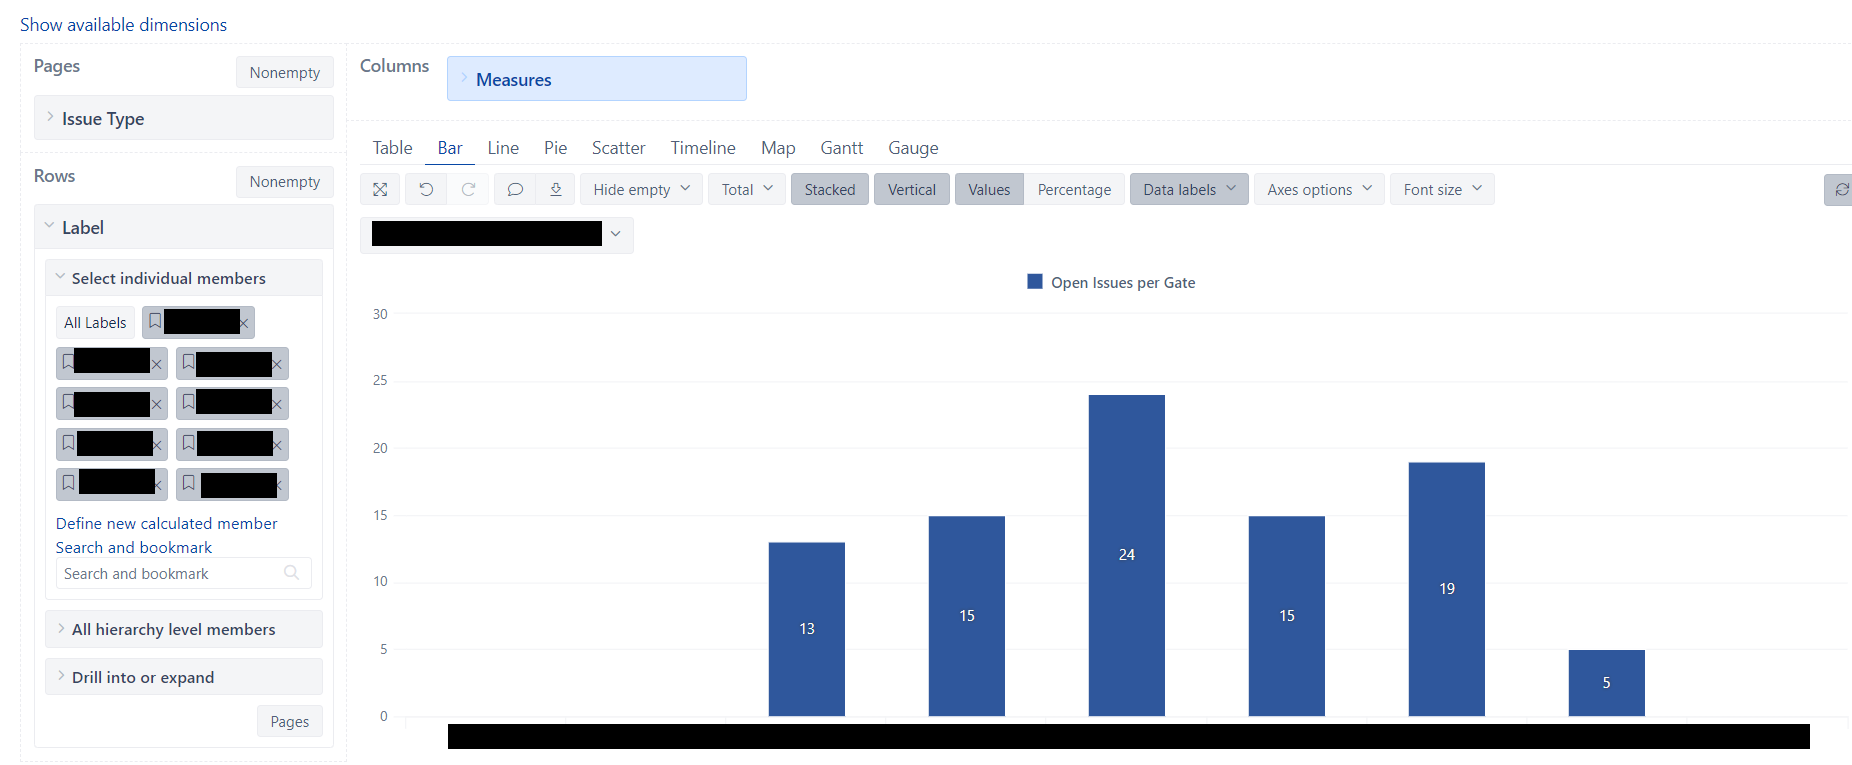
I have the following report which is a graphical representation of issues for each gate (from Gate 1 to Gate 9). The information about Gates is stored into Labels.
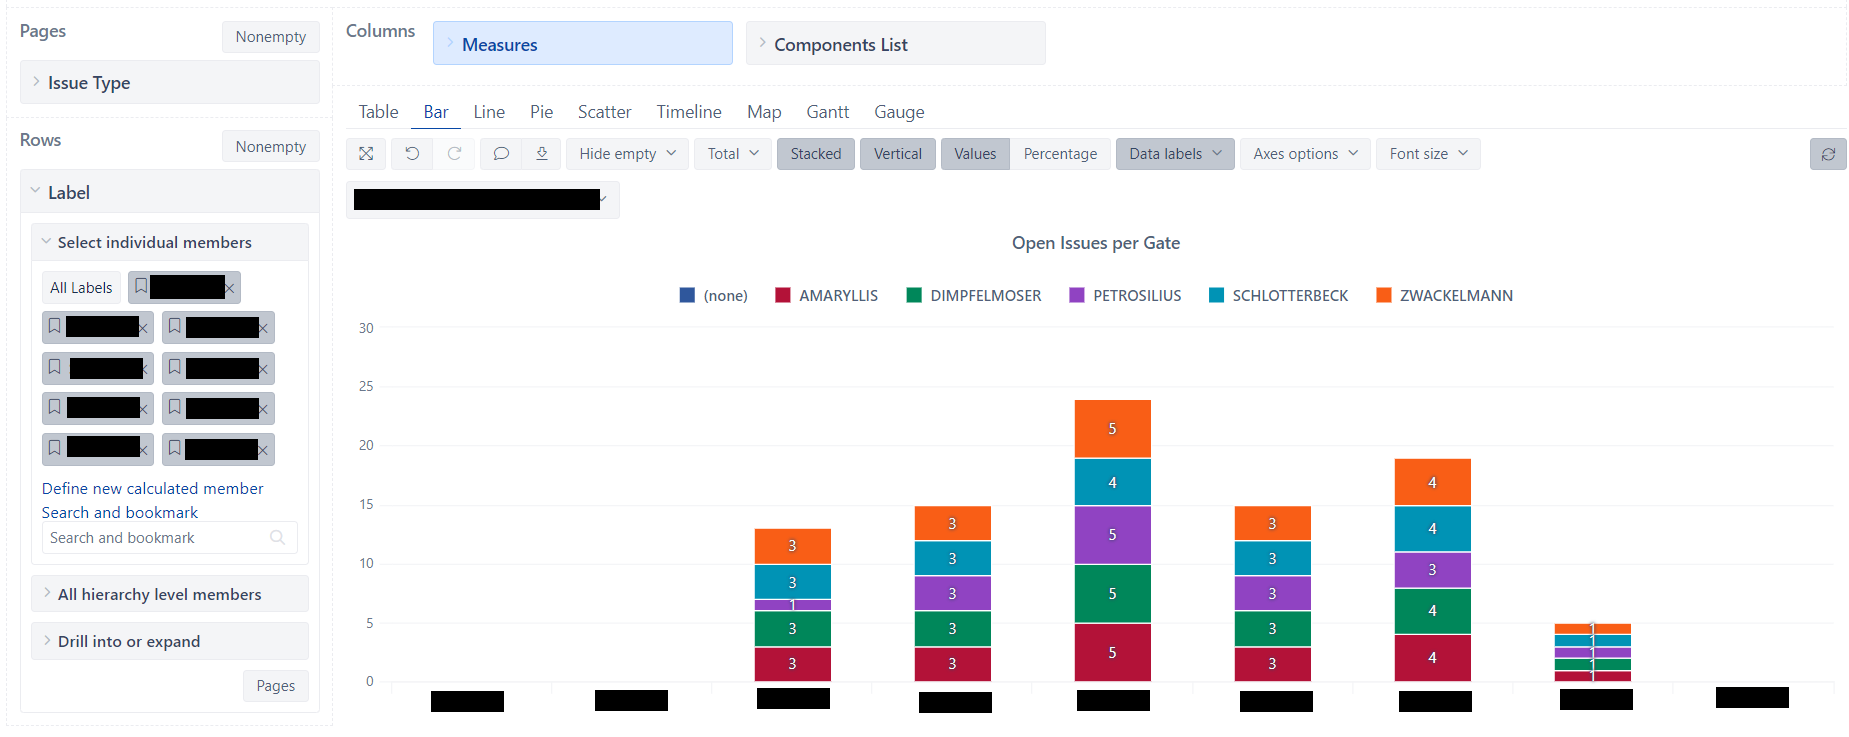
Now, we need to visualize, for each gate, the issues by each Discipline, which is, again, kept into the Label field. The report have to look something like the image below (I’ve used the Components List, but it’s not what we need), but I don’t know how I can “split” the existing issues by the Disciplines which are part of the Label field…
Into the Calculated Measure we already have the “Open Issues per Gate” measure.
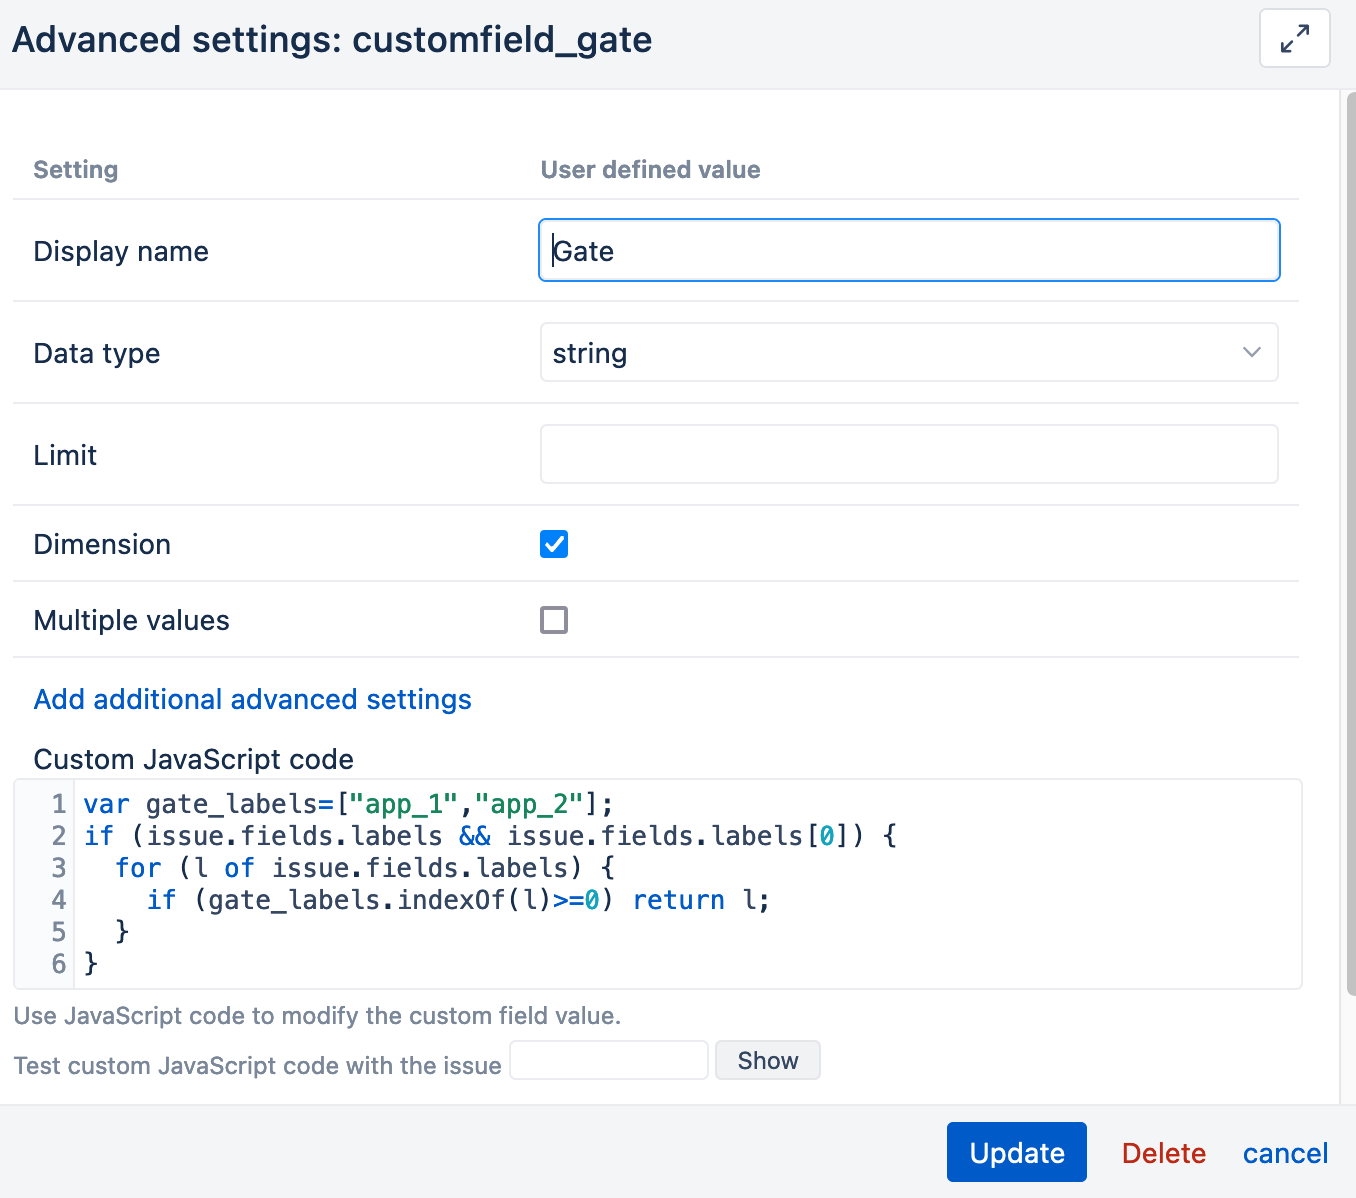
I’ve read something about “Custom Measures”, and we might define something which will use the Labels field. I’ve thought about having something like this into the advanced settings (I don’t know if it would work), but I don’t think that I will be allowed to add a new dimension like this, as the eazyBI instance is not managed by us…
[jira.label]

name = “Label New”

data_type = “string”

dimension = true
Isn’t there an easier solution to filter by label by Row (by Gate) and by Column (by Discipline) by using the same field, Label?
Thank you!