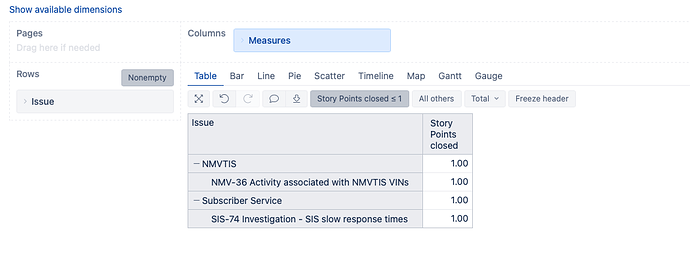
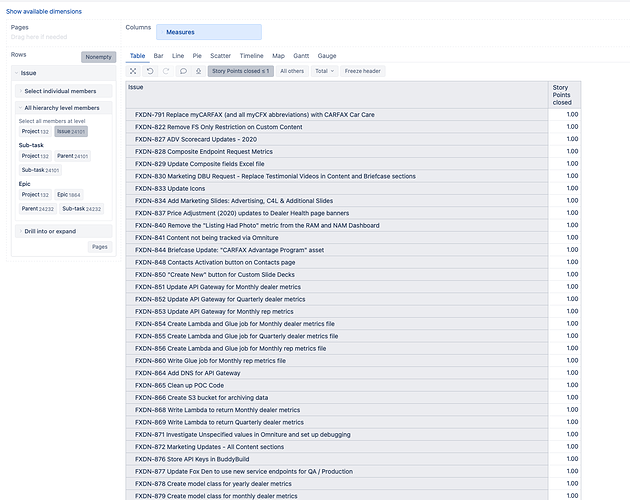
I am trying to build a report that has a list of all projects with issues that have story points <= 1
If I filter based on issues I get the results I expect but can not able to see a column by project
Hi @briantaylor
In this case, you could use advanced settings and enable the dimension import for custom field “Story points”
I have requirement to display the Number of Sprints based on points.
For example:
1 - 0 point story (defect) was worked in the sprint
2 - 0.5 point stories were worked in the sprint
3 - 1 point stories were worked in the sprint
4 - 2 point story were worked in the sprint
2 - 3 point stories were worked in the sprint
3 - 5 point stories were worked in the sprint
There is 1 Story with 0 point in Sprint.
There is 2 Story with 0.5 point in Sprint.
So on and so forth…
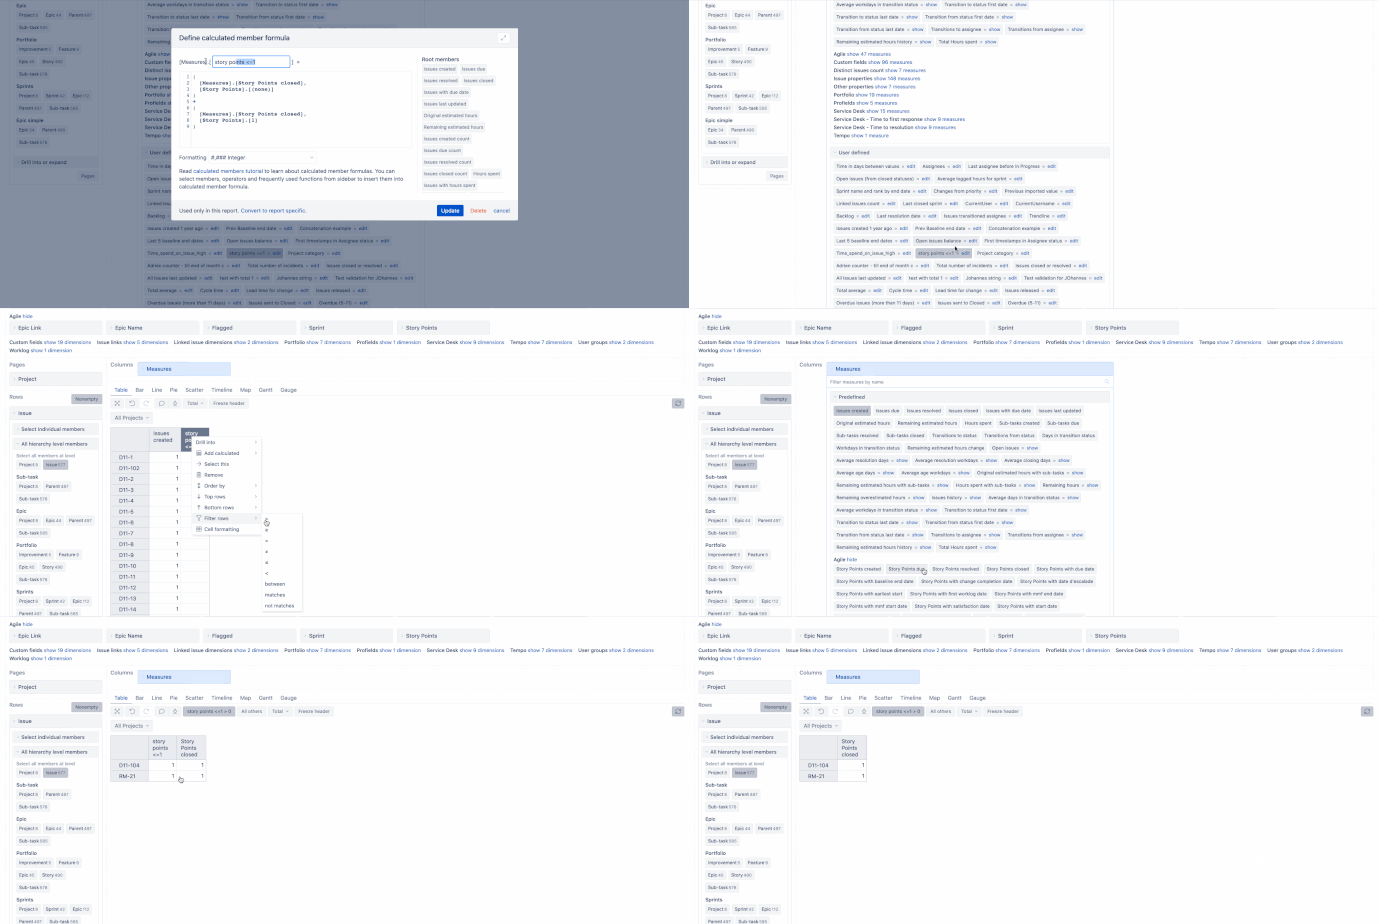
Next, create a new user-defined calculated measure to sum results from issues without story points and issues with 1 story point.
(
  [Measures].[Story Points closed],
  [Story Points].[(none)]
)
+
(
  [Measures].[Story Points closed],
  [Story Points].[1]
)
Finally, filter the report rows by this new calculated measure (New measure > 0) and remove it from columns when the filter is set.
Martins / eazyBI support


