I would like to calculate the (average) time of issues which have been assigned to a certain group “B”.
So out of all issues I want to filter those out, where a certain group was involved in general (so if group B was onced involved / assigned to this issue, I want to filter all those issues out). Afterwards I want to calculate the average time of those issues, from opening to closing.
In JIRA itself the filter looks like:
project = “baloon” AND labels in (FLY-Check) AND “AERO Modules” in (A, B , C, D, E) AND assignee was in (FlyingPersonA, FlyingPersonB) AND (status was Closed AND status in (Open, “In Progress”))
Any idea how to handle the “was assigned” and the filter itself?
Right now I am able to calculate the average time of the transitions made by the certain group of assignees; but this does not include the whole time of the issue (where different people are working on; just the time spent be the assignes).
This would be step one.
Afterwards I would like to (optionally) flatten the data. The 10% of the fastest and slowest issues should then be removed.
Find all issues, where a Team (aggregated set) got in touch with (made any transitions / where in anyway involved).
Issues, where XX has been assigned to in (transition/log) history.
Show/Use only those issues, where a set (aggregated value) of tansitions where made (to prevent counting reopened-issues which have been already closed).
I guess this could be applied somehow with Pages? But if I define a Aggregation of Transitions in Pages, it doesn’t show me any data.
1&2 should be in such a way, that different operations (calculations) could be applied on the filtered set of data, out of 1&2.
Like: Calculating the average time of the filtered issues (out of 1&2) from opening to closing.
Flatten the data: Remove 10 % of the fastet and slowest issues
Different couloums (lines in the graph) for different Labels (so that the different Labes could be compaired 1:1)
Line total (A+B),
Line LabelA
Line LabeB
In JIRA itself the filter looks like:
project = “baloon” AND labels in (FLY-Check) AND “AERO Modules” in (A, B , C, D, E) AND assignee was in (FlyingPersonA, FlyingPersonB) AND (status was Closed AND status in (Open, “In Progress”))
@zane.baranovska@martins.vanags@roberts.cacus
Since my due date is getting closer, and I am not able to find a solution for my problem / to solve the clue, I would really appreciate any help.
Thank you for the detailed description.
You may try the following calculation that would calculate the average age days (from created date until today ) of reopened (and currently not closed) issues that have been assigned to the selected assignee users or groups:
Avg(
  Filter(
    Descendants([Issue].CurrentMember, [Issue].[Issue]),
--issue currently is not closed
    IsEmpty([Measures].[Issue closed date])
--issue is created within the selected time period, if you use Time dimension in report
    DateInPeriod([Measures].[Issue created date], [Time].CurrentHierarchyMember)
    AND
--had been closed previously but moved out of status Closed
    ([Measures].[Transitions from status],
     [Transition Status].[Closed],
     [Assignee].DefaultMember,
     [Time].CurrentHierarchy.DefaultMember)>0
    AND
--has been assigned to the selected in Pages assignees
    ([Measures].[Transitions to assignee],
     [Time].CurrentHierarchy.DefaultMember)>0
  ),
--issue age until now
   DateDiffDays([Measures].[Issue created date], Now())
)
Set decimal formatting.
Then put the report together.
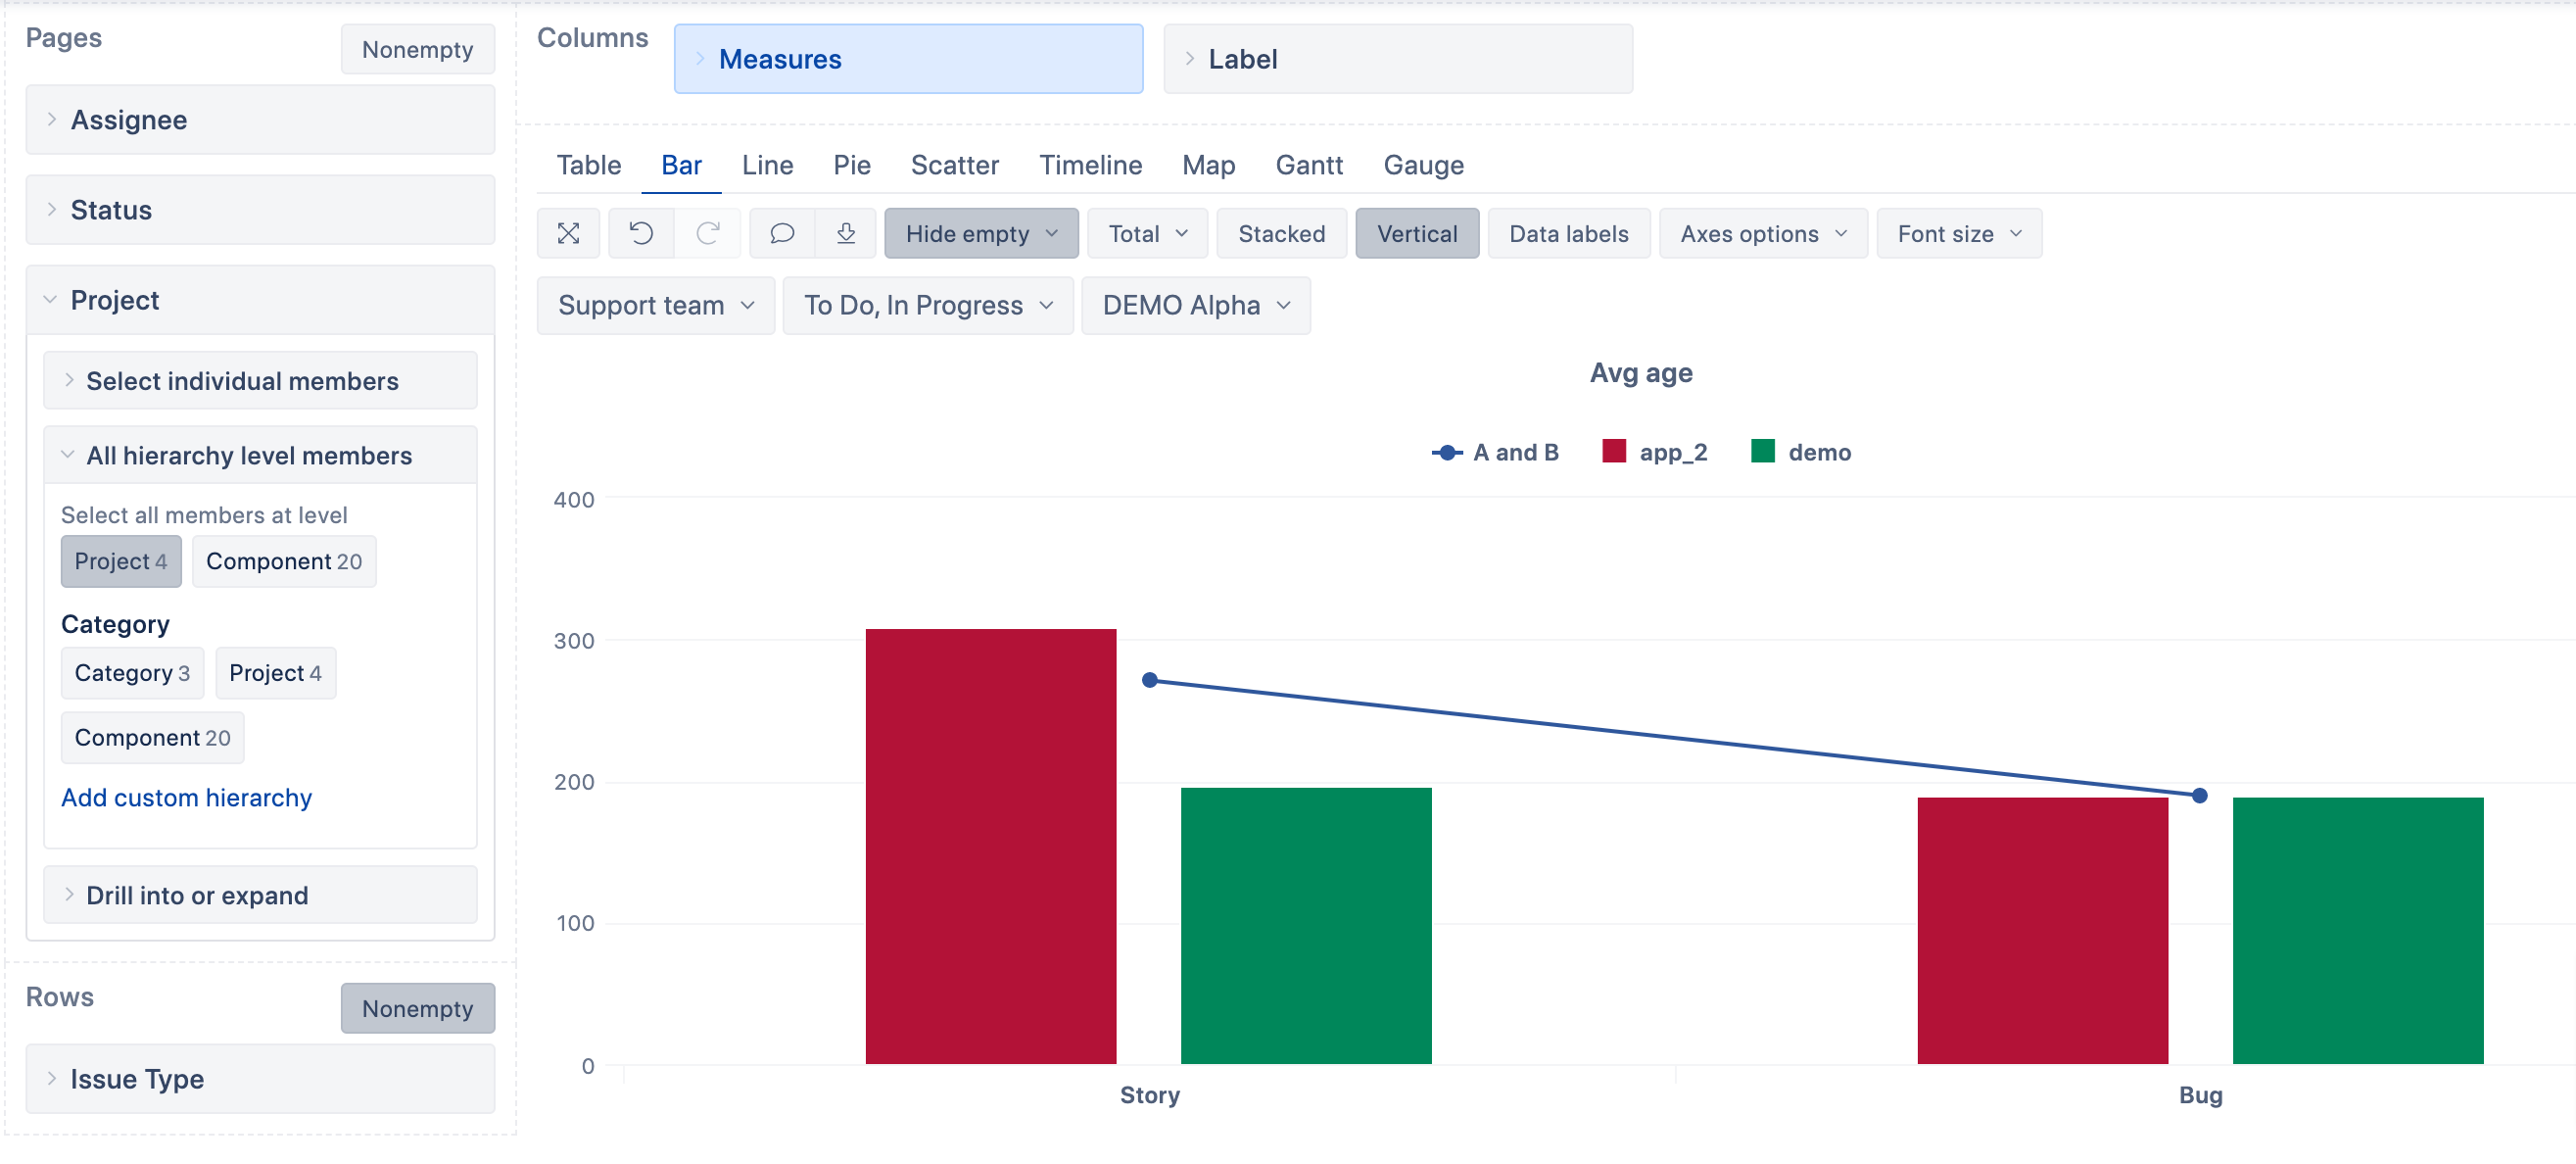
Add, in Pages, Assignee (calculated member) or Assignee Group, Project and AERO Modules dimensions and select your values; they will be applied to the measure. Also, add Status dimension and select statuses Open and In Progress (for including only currently Open and In Progress issues).
In columns, add the measure, and aggregated Label dimension member and expand it.
In rows, add the dimension you need (if you added Time, issues would be grouped by their creation date).
Please try this out if this meets your needs for filtering and the average calculation. Though, I am not sure about 90% flattening; how did you imagine that?
Unfortunately there was a missunderstanding.
I replied you by your mail (see for more details).
Right now I tried to fix it, but right now, it doesnt work at all
My calculated measure looks like:
Avg(
Filter(

Descendants([Issue].CurrentHierarchyMember, [Issue].[Issue]),


[Measures].[Issues closed] > 0 AND

DateInPeriod([Measures].[Issue closed date], [Time].CurrentHierarchyMember) AND
-- MISSING to filter all reopend issues out (those who moved from closed --> X

--has been assigned to the selected in Pages assignees
    (([Measures].[Transitions to assignee],
     [Time].CurrentHierarchy.DefaultMember)>0)

--[Measures].[Issue created date]
)
,
DateDiffDays([Measures].[Issue created date], [Measures].[Issue closed date])

)
If I try to open my report, it’s loading and loading (I’ve selected Time in rows, and Page, as Weekly, for current year).