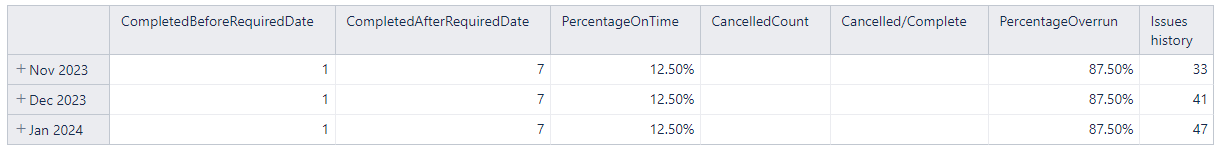
I currently have a table/chart which shows a number of fields which contain the outcome from comparing 2 custom date fields. It seems to be working well with the exception of there is no breakdown per month.
I have confirmed that the values are actually different each month but cannot work out how to actually show this in my table and charts.
Completed Before Required is:
NonZero(
Count(
Filter([Issue].Members,
/NOT IsEmpty([Measures].[Issue Actual Completion Date])/
[Measures].[Issue status]=“Completed”
AND
DateCompare([Measures].[Issue Actual Completion Date],
[Measures].[Issue Required Date])<=0
)
)
)
Completed After Required is:
NonZero(
Count(
Filter([Issue].Members,
/NOT IsEmpty([Measures].[Issue Actual Completion Date])/
[Measures].[Issue status]=“Completed”
AND
DateCompare([Measures].[Issue Actual Completion Date],
[Measures].[Issue Required Date])>0
)
)
)
What do I need to add to get this broken down into a monthly total rather than the same values for each month which will grow over time.
Hi @R_J,
The reason for the same figure appearing on all months is that the current expression is in no way related to the Time dimension.
You might link the expression to the report context by using some genuine measure within the expression or to the Time dimension using some issue property that relates to [Time].CurrentHierarchyMember.
You might try using the measure [Measures].[Issues with Actual Completion Date] to filter issues against all dimensions in the report context.
You might as well convert the Count() to Sum() and use the genuine measure to check the relation to the report context.
An alternative is to check if the “Actual Completion Date” falls within the current time period by using the following condition.
One more improvement is to iterate through a reduced dataset of issues instead of full iteration through all issues in the data cube for each cell.
You might put the Isuse dimension on report rows to allow the selection of relevant Projects. Then, you might benefit from the following construction when creating the set of issues.
One more step is to create several layers of conditions so that “heavier” or “slower” conditions are only executed on a reduced dataset.
So, the suggested expression for finding the issues completed within the displayed month and earlier or on the Required Date might be as follows.
Sum(
--filter the relevant issues only
Filter(
--create set of issues within selected projects
DescendantsSet(
 [Issue].CurrentHierarchyMember,
[Issue].[Issue]),
--filter conditions for individual issues
--primary condition - completed within the period - based on issue properties
DateInPeriod(
[Issue].CurrentHierarchyMember.Get('Actual Completion Date'),
[Time].CurrentHierarchyMember)
AND
--another primary condition - issue current status - based on issue properties
[Measures].[Issue status]="Completed"
),
--numeric value for sum
--secondary condition - issue completed early or on time
--executed on reduced dataset
CASE WHEN
DateCompare(
[Measures].[Issue Actual Completion Date],
[Measures].[Issue Required Date])<=0
THEN
-- genuine measure to check relevance to report context
[Measures].[Issues with Actual Completion Date]
END
)
The “CompletedAfter” would use a different comparison on line 23.
Regards,