I have an Issue type that I want to show the following report
Per Quarter
Show the total of Created Issues that have >2 occurrences of remote connection
Show percentage of >2 remote connections from all Created issues of that Issue type for that quarter
I have tried a number of ways and just get errors so I would appreciate some assistance
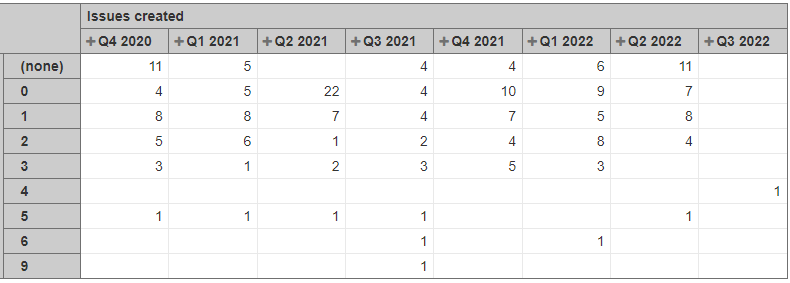
I assume that in the Rows section, you have a custom dimension “Remote connections”.
You can define a new calculated member in this dimension that will Filter and Aggregate all of the Remote connection members with a value above “2”:
Hi
Thank you
This worked well on the first run but I have now hit a bug that for some reason it will no longer show the output
The output was correct and worked fine
But all the same
Thank you
I will resolve the bug and use this