I have a couple calculated fields that I made using the “Add Calculate --> Stat --> Avg” and it works for getting the data but I’m a little confused how to get them out of the individual issue rows and into the top level project row to show the averages at a high level.
I’ve started to play around with different measures but I just cant figure out how to get them into that top column. I am new to EazyBI and just starting learn and go through documentation but this one little snag has got me stumped.
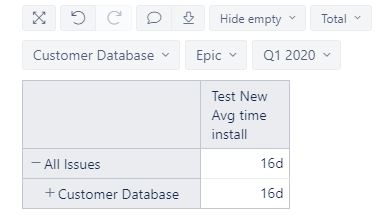
Ok so I was able to get it using some other examples and the average calculation found in the top headings, which is a very helpful feature, but now I’m curious how to actually show the numbers only in the “Customer Database” row. It seems when you minimize it the values go away, which makes sense but I’m trying to just build out 4 gauge charts with this information. Right now it’s making 4 charts for each issue which is just absurd looking but almost there I think.
Avg(
  Descendants([Issue].CurrentMember, [Issue].[Issue]),
  CASE WHEN NOT IsEmpty([Measures].[Time to Installed]) THEN
  Avg(VisibleRowsSet(), [Measures].[Time to Installed])
  END
  )
END
Just for completeness here… Seems with some guess and checking I was able to figure out that the second average was just looking for what’s visible so changing that to [Issue].CurrentMember resolved everything I asked for. So for completeness the final answer to what I was looking for is below.
Avg(
  Descendants([Issue].CurrentMember, [Issue].[Issue]),
  CASE WHEN NOT IsEmpty([Measures].[Time to Installed]) THEN
  Avg([Issue].CurrentMember, [Measures].[Time to Installed])
  END
  )
END
You are on the right track! Yes, the standard calculations are dynamic based on the chosen measure and visible rows in the report.
To see the average (or any other aggregator) on the top level, you would filter the set over which you wish to calculate it and provide the measure to the Avg(…) function (in your last formula the second Avg(…) is redundant):
Avg(
  Filter(Descendants([Issue].CurrentMember, [Issue].[Issue]),
    [Measures].[Time to Installed] > 0
  ),
[Measures].[Time to Installed]
)
Thanks for that explanation. I’ve modified what I had to your command, I do have two questions though.
When I’m doing the initial calculation for [Time to Installed] it’s just using the date diff days function. If there’s a record that has 0 days between the two it just shows “d” which makes sense but wanted to clarify if the average is still counting them when doing the math against all the numbers. Since 0 days would bring the total avg down I would definitely want it counted. I think it’s just a difference between the original “When Not isEmpty” I had versus the >0 you have. If I switch it to >= I get my original number which I think all makes sense but was curious.
Second, when I make the Time dimension a page and try and filter against different Quarters to get the average for those quarters the values aren’t change. I’m playing around in there and will hopefully figure it out but I’m guessing it’s just something in the formula looking at all of the results from the Project/Epics chosen or something else… Any pointers would be helpful. Thanks
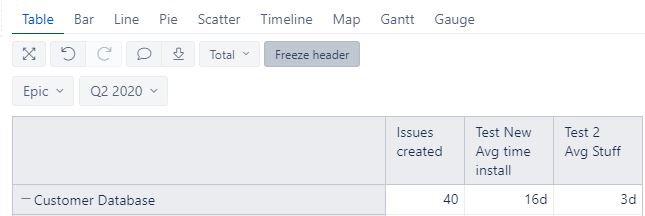
So basically I’m back to where I started with visible row being my starting point but trying to figure out the filtering to get it to appear like below. The “Test New Avg time install” is set up with what you gave me above so it’s just iterating over the entire “Customer Database” but the “Test 2 Avg stuff” column is just the below which gets what I want but it’s back to the visible problem when I collapse it to just show the over. Plugging away but wanted to see your thoughts.
Avg(VisibleRowsSet(), [Measures].[Time to Installed])
Yes, the average is calculated over the filtered set. If the greater than zero condition is used, then the members with zero values are left out. You can use the NOT isEmpty(..) instead.
There is a very useful debugging function SetToStr(..). You can check over what set the average is calculated even when you change the page selection, and then see what filtering options you need:
SetToStr(
  Filter(Descendants([Issue].CurrentMember, [Issue].[Issue]),
    [Measures].[Time to Installed] > 0
  )
)
Possibly, in this case, if you wish to calculate the Avg(..) of Customer Databases, you would use that dimension instead of Issues.
Avg(
  Filter(Descendants([Customer Databases].CurrentMember, [Customer Databases].[Customer Databases]),
    NOT isEmpty([Measures].[Time to Installed])
  ),
[Measures].[Time to Installed]
)
Note that it is important how Time to Installed measure interacts with the Time dimension.
Please let me know if you have further questions regarding this!
Lauma / support@eazybi.com
Emailed support with further question but just using your example and the SetToStr I was able to eventually get to the final result where I think you were heading in the right direction since my “Time to install” was only the below and not using any time in it so I’m guessing it just does it based off of everything as I kept seeing. I’m playing around with it and figure I can add the DateInPeriod to either Measure and it would work but the final average below appears to get what I want. Thank you for all that support!
DateDiffDays([Measures].[Issue created date],[Measures].[Issue Install Date])


Avg(

  Filter(Descendants([Issue].[Customer Database], [Issue].[Issue]),

    NOT isEmpty([Measures].[Time to Installed]) AND
    DateInPeriod( [Measures].[Issue created date],
      [Time].CurrentHierarchyMember )

  ),

[Measures].[Time to Installed]

)