Hey all,
Super new to EazyBI, so I apologies for any easy to answer questions.
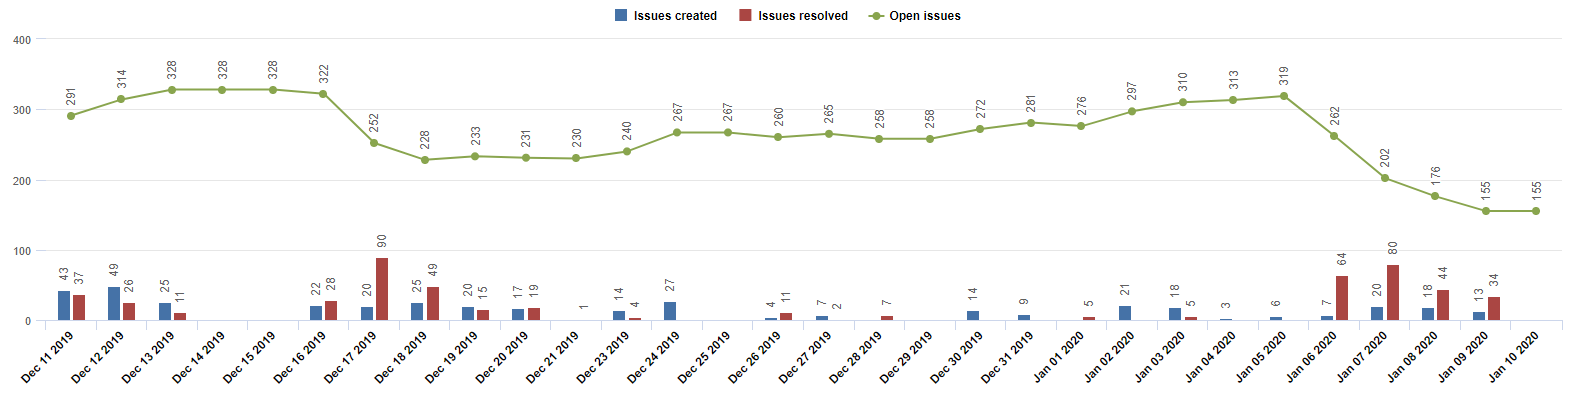
I’ve created a report which displays the following -
Previous 30 days -
- Issues created (bar)
- Issues resolved (bar)
- Open issue count (line)
I’d like to be able to have a continuation of the open issue count line, which shows the forecast, based on the created/resolved rate. Ultimately, giving me an estimated date to hit bug 0.
Can provide more information if required!
Hi @Seb_Jordan
Welcome to the eazyBI community!
You may want to draw a simple Open issues trend line and look when the line crosses the 0.
For that, you may want to use standard trend line calculation: click on the column “Open issues” header and “Add calculated” --> “Linear trend” and the trend line will be automatically created. Read more about standard calculations here https://docs.eazybi.com/display/EAZYBIJIRA/Create+reports#Createreports-Addstandardcalculationsbasedonaselectedmeasure
To get the line more meaningful, you may additionally do the following.
- Consider what time period you may want to take into account for the trend calculation: all the previous time period or only, let’s say, last few weeks? The trend line would be calculated based on the displayed time period in the report rows.
In the report table, use date filter with relative dates to set from what time the report timeline should start: https://docs.eazybi.com/display/EAZYBIJIRA/Date+filters
-
Add future time periods so the trend line would have corresponding date members as described here: https://docs.eazybi.com/display/EAZYBIJIRA/Create+reports#Createreports-AddmemberstoTimedimension
Best,
ilze, support@eazybi.com
1 Like
Thank you for the help ilze!
Frustrating that the solution for a trend was staring me right in the face! But that’s just the way it goes I guess.
I now have a linear trend line, but I’m also seeking the following -
- Setting date ranges to “time between 15 days ago and 30 days from now” only shows me 8 days into the future? (See image attached)
- Ideally, I would like a date shown on the chart that reflects when this linear trend would hit 0. So, instead of having a huge line that leads all the way to the end of the linear trend. I could have a box that says “Bug 0 date: Feb 23 2020”
Is this at all possible?
Thank you for your help so far!
Seb
Hi,
Great that you found this feature useful! It is a new feature and usually, it takes time to get familiar with it.
- “Setting date ranges to “time between 15 days ago and 30 days from now” only shows me 8 days into the future? (See image attached)”
For some reason, I do not see the attachments.
Time dimension contains only dates when some measure is captured and, consequently, the filter would return only those dates. Therefore, you would need to add missing dates as described here: https://docs.eazybi.com/display/EAZYBIJIRA/Create+reports#Createreports-AddmemberstoTimedimension
- Ideally, I would like a date shown on the chart that reflects when this linear trend would hit 0. So, instead of having a huge line that leads all the way to the end of the linear trend. I could have a box that says “Bug 0 date: Feb 23 2020”
That kind of date should be additionally calculated. You may want to check out our demo report where a project end is predicted (in other words, the date when 0 issues would be left unresolved, based on the past resolution pace) and reuse the calculations: https://eazybi.com/accounts/1000/cubes/Issues/reports/187049-predicted-completion-date
Hope it will help!
Kind regards,
Ilze, support@eazybi.com
Hey ilze,
Sorry again, but I’m a real EazyBI noob! I’ve tried to get my head around the calculated measure and think I understand what it’s doing. However, getting it to function correctly for my project has proven more difficult. Copying the formula exactly didn’t work, as I use slightly different predefined measures to calculate number of open bugs at all times. I tried editing the formula to match the graph attached in my first comment, but no luck.
What the prediction does not is return today’s date all the time.
One thing I am trying to do that layers on top of the example report, is define a “Version” via the Pages, to be taken into account. Ideally, the measure would also checked with version is current selected in pages and determine the end date based on the date that fix version was created and the issue resolved rate. (How long till there are 0 bugs with that version)
If possible, I could share with you the report so you can help investigate? - There is also a question of confidentiality which it’d be useful for me to understand? 
Seb