Formatting a Stack Chart from Highest to lowest values

Hi EazyBI,

I am wondering if there is a way to format a stacked chart so it shows the values total from highest to lowest, currently my chart looks like this:

I am looking to have it look like this without needing to add a total column to the functions to be able to format accordingly:

Thanks.

Hi @dcachia,

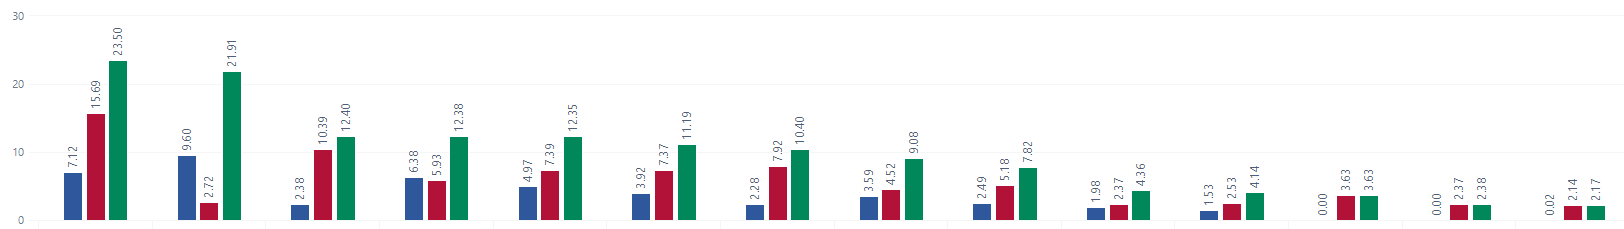
Once you have filtered the report by the total column, you can exclude it from the stack by clicking on its legend. Then change its type to “text” or “scatter”, and it won’t disturb the view. Additionally, you can add a label to it to view the total value above the stack. See the suggestions in the pictures below:


Please find more options for customizing eazyBI charts here - Customize chart.

Best,
Roberts // support@eazybi.com

Thank you @roberts.cacus. That is exactly what I needed.

1 Like